AWS Business Intelligence Blog
Joulica unifies real-time and historical customer experience analytics with Amazon QuickSight
This is a guest post by Tony McCormack from Joulica.
In this post, we discuss how Amazon QuickSight has allowed us to achieve our goal of unifying real-time and historical analytics for our customers. Joulica is an Ireland-based startup in the contact center industry. Our founders previously led contact center research and development for a global contact center technology provider, and we founded Joulica because we saw that the shift to the cloud and growing demand for data and analytics would transform the customer service industry. Our platform delivers real-time and historical analytics across the wide variety of data sources and customer interaction channels that are now common in most organizations.
It is our mission to make customer experience analytics accessible to all users in an organization. Our customers need to have instant access to the current state of ongoing customer engagements as well trends and historical data patterns. They find it difficult to harness all of the data sources needed to achieve this, particularly in real time. To help solve this problem, we chose Amazon QuickSight, a cloud-native business intelligence tool that allows you to embed insightful analytics into any application with customized, interactive visuals and dashboards.
Embedding QuickSight to provide a 360-degree view
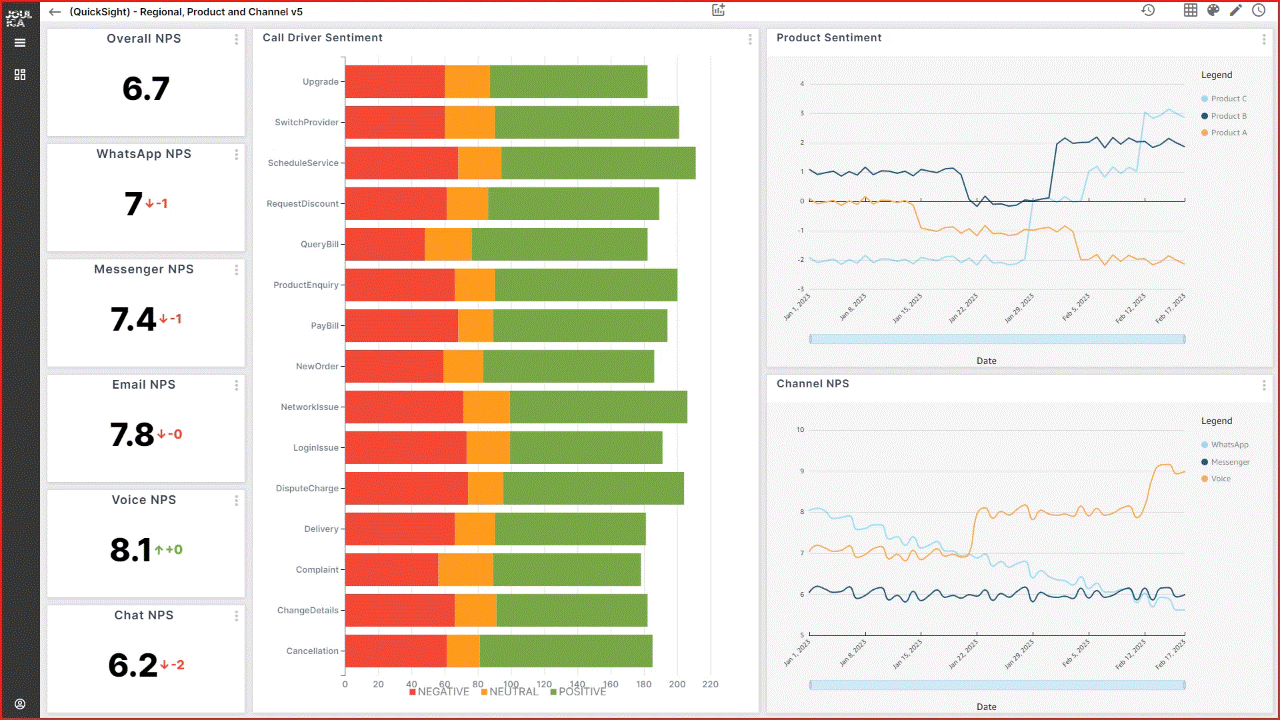
At Joulica, our specialty is real-time analytics. Real-time analytics means that as soon as new data is available, analytics are updated, including any visualizations that are currently being viewed by end-users. The rich embedding capability of QuickSight allowed us to use QuickSight for historical analytics and our technology for real-time analytics, all in one place. Visual embedding with QuickSight has saved us greater than two resource years of research and development time, enabling us to serve customers sooner. We have also been able integrate Joulica real-time analytics into QuickSight dashboards—so within QuickSight, our users can use both standard QuickSight visualizations and Joulica widgets, as shown in the following example.

Our customer journey analytics go beyond typical contact center reporting, and stitches together how customers interact with organizations across channels. By pushing our analytics to QuickSight, we allow users to dive deep into patterns as well as individual customer journeys.
Integration with Amazon Connect and other AWS services
One of the main reasons we chose QuickSight was because of its alignment with Amazon Connect and the extended set of Contact Center services that AWS provides. As the leading provider of analytics for Amazon Connect, this was essential. We are deeply integrated with the full capabilities of Amazon Connect, including Amazon Lex and Contact Lens. In the preceding example of a QuickSight dashboard, we see that as soon as a KPI is updated, the visualization automatically updates. Behind the scenes, Joulica is ingesting Agent Event Streams, Contact Events, and a host of real-time data feeds from Amazon Connect, analyzing them and pushing a stream of real-time analytics to these widgets. This enables our customers to have up-to-date information, in addition to the historical context, empowering them to improve contact center performance and make better decisions. This is all visualized within QuickSight.
We can also ingest data from Amazon Kinesis and Apache Kafka, allowing live analytics from additional data sources to be visualized.
Empowering our customers with insights in QuickSight
The key goals driving the need for analytics in the contact center industry are customer experience optimization as well as efficiency gains. This is relevant across all customer touchpoints, including digital channels, traditional contact center channels, and emerging areas such as social and smart devices. In addition to KPIs related to service levels and agent performance, organizations need access to customer feedback and sentiment analytics, as well as an explanation of how these are related to business performance such as sales and customer retention. With QuickSight, we can offer out-of-the box analytics for all of these areas. The following example shows how easy it is to use the Quicksight visual embedding feature to extend one of our real-time visualizations to show a geographic breakdown of customer survey results.
Thanks to the QuickSight and AWS pay-as-you-go pricing model, we can provide real-time and historical embedded analytics to our customers automatically. We have saved significantly by choosing QuickSight, both in cost and development time, and the cost savings provided by Quicksight is passed down to our customers. Like AWS, our pricing is usage-based, meaning that our customers can scale as their operations grow.
We currently have customers in North America, United Kingdom, the EU, and APAC. As we continue to grow, we plan to explore other QuickSight features like Amazon QuickSight Q, as we pursue providing more ways for our customers to analyze, visualize, and interpret their contact center data.
To learn more about how you can embed customized data visuals and interactive dashboards into any application, visit Amazon QuickSight Embedded. To learn more about Joulica, please visit Joulica.io.
Join the Quicksight Community to ask, answer and learn with others and explore additional resources.
About the Author
 Tony McCormack is the CEO and Co-founder of Joulica. Based in Galway, Ireland, he is focused on providing enterprise-grade reporting and analytics for Amazon Connect, Salesforce Service Cloud, and other platforms in the customer experience market. He has extensive experience in the contact center domain, with a passion for real-time analytics and their integration into end-user applications.