article thumbnail

Creating an Alternative Law School Rankings Report

Juice Analytics

News Takes Aim at Top Law Schools” ( paywalled ) about how Law Schools are fed up with the US News & World Report rankings, and how the magazine is fighting back. With this type of interactive report, we think about a few key things: How do we provide interactivity so the user can make the results most relevant to their needs?

article thumbnail

Storytelling for CIOs: From niche to bestseller

CIO Business Intelligence

The late Richard Sykes, CIO of pharmaceuticals giant ICI in the 1990s and later a columnist for CIO magazine, famously scripted starkly different scenarios of the future of ICI for board members early in his IT role. The worst are the ones with tons of text, slightly better are the ones with bullets, and the best are in a visual story format.

Insiders

Sign Up for our Newsletter

This site is protected by reCAPTCHA and the Google Privacy Policy and Terms of Service apply.

article thumbnail

Serving Customers with Virtual Reality in the Metaverse

Smart Data Collective

Virtual reality is revolutionizing the way businesses engage with their customers, offering enhanced experiences and immersive interactions. With the advancement of technology, the metaverse has become a virtual reality space where users can interact with each other and the digital world.

article thumbnail

Take Advantage Of The Top 16 Sales Graphs And Charts To Boost Your Business

datapine

The question and answer we included come from an actual interview that Fortune magazine did with billionaire Tilman Fertitta. This gives to that sales graph an overall sense of visual contrast which makes it much more digestible at a glance. 8) Revenue And Sales Interactive Management Overview. From Fiction To Reality.

Sales 235
article thumbnail

Why Metaversial Business Is a Very Long Way Off

Mark Raskino

A Fortune magazine article told how then CEO of IBM Sam Palimsano was keen on it, and how he and his his avatar were already hanging out in virtual world meetings. If VR data visualization and meeting doesn’t work for the industry with the most money to invest – why would other industries take it up? But business VR didn’t happen then.

article thumbnail

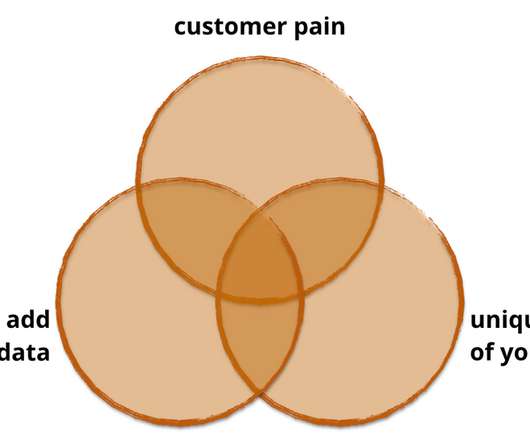
A Guide to Building Better Data Products

Juice Analytics

However, the data was essentially stored in old copies of the paper magazine, not a format that was conducive to delivering insights to their target audience. (3) There are many paths to consider: Visual representations that reveal patterns in the data and make it more human readable. People don’t want data, they want solutions.

article thumbnail

Marie Kondo Has Some Advice for Your Dashboard

Juice Analytics

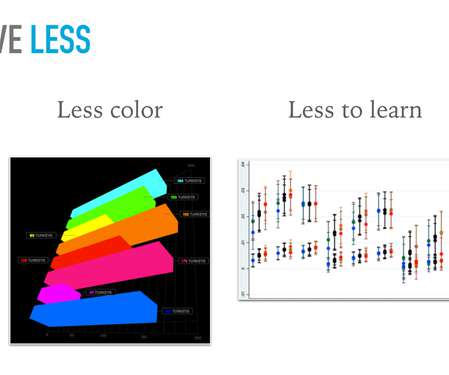
In our workshops on data storytelling, dashboard design, and data visualization, we are always emphasing the need to simplify. You can also cut out photos from magazines. A dashboard or report is composed of a bunch of different elements: key metrics, charts/visualizations, titles and labels, and filters. Less is more.