article thumbnail

10 Examples of How Big Data in Logistics Can Transform The Supply Chain

datapine

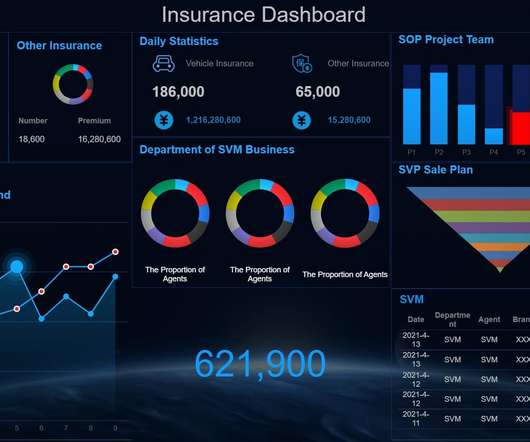
Using the right dashboard and data visualizations, it’s possible to hone in on any trends or patterns that uncover inefficiencies within your processes. However, big data and the Internet of Things could give delivery drivers and managers a much better idea of how they can reduce costs due to perished goods. million miles.

Big Data 275
article thumbnail

Visualize Amazon DynamoDB insights in Amazon QuickSight using the Amazon Athena DynamoDB connector and AWS Glue

AWS Big Data

These include internet-scale web and mobile applications, low-latency metadata stores, high-traffic retail websites, Internet of Things (IoT) and time series data, online gaming, and more. Finally, to visualize BI insights, you can use Amazon QuickSight , a cloud-powered business analytics service.

Insiders

Sign Up for our Newsletter

This site is protected by reCAPTCHA and the Google Privacy Policy and Terms of Service apply.

Trending Sources

article thumbnail

Examples and uses of GIS

IBM Big Data Hub

Geographic information systems (GIS ) visualize and make sense of this data, helping people and businesses better understand the patterns and relationships of our world. In its most recognizable form, a GIS visualization is what you see when you route a trip on Google Maps. ” can be answered by geospatial data and GIS.

article thumbnail

The journey to a mature asset management system

IBM Big Data Hub

Robots and drones perform inspections by using AI-based visual recognition techniques. Machine connectivity through Internet of Things (IoT) data exchange enables condition-based maintenance and health monitoring. The focus of the asset management organization shifts toward uptime and business value by preventing failures.

article thumbnail

Big Data Makes Smart Buildings the Norm in the 21st Century

Smart Data Collective

You have probably heard a lot talk about the Internet of Things (IoT). Facility managers can now use new technologies, such as data visualization dashboards, to view the performance of their building. Building operators can even use charts and graphs to make data visual. It is one of the biggest trends driven by big data.

Big Data 133
article thumbnail

Glossary of Digital Terminology for Career Relevance

Rocket-Powered Data Science

Computer Vision: Data Mining: Data Science: Application of scientific method to discovery from data (including Statistics, Machine Learning, data visualization, exploratory data analysis, experimentation, and more). They cannot process language inputs generally. Industry 4.0

article thumbnail

Unlocking value: Top digital transformation trends

IBM Big Data Hub

Trend: Edge computing and the Internet of Things More distributed devices will require increased interconnectedness to drive value. The Internet of Things (IoT) enables technologies to connect and communicate with each other.