
Anyone who manages inventory is familiar with stock coverage. The question is, how do you calculate a 'days cover' metric and make sure you have just the right level of stock on hand?
If you’re a distribution company, managing stock coverage is essential and having accurate stock measurements at your fingertips is the difference between turning a profit or not. The sooner you move your inventory, ship it at the lowest cost and not get caught with too much dead stock, the better your balance sheet.
Let's look at some of the more common measures involved with analyzing your inventory coverage.
- Stock on Hand (SOH) — Current stock levels by SKU (stock keeping unit), by product group, or by warehouse location.
- Sales History — It’s best to introduce the actual sales demand for your products to give you the basic supply and demand picture.
- Average Monthly Unit Sales — Incomes and sales average for the last 3, 6 & 12 months by product for a better understanding of how each product has been performing over time including seasonal influences on product sales (i.e. A pool chemical distributor will want to view demand by season Winter vs Summer, or a giftware company will want to track sales against Valentine's day vs Mother’s day vs Christmas, etc.)
- Stock On Order (OO) or Stock In Transit (IT) — you will need to account for this and add to the stock levels since you will be receipting (cash has been allocated) for these goods into your warehouse once they arrive.
- Sales Back Orders (BO) or Committed Stock (CS) — these units will need to be added to the equation since this is stock that will be coming out of the inventory levels as it is being prepared to ship or waiting for stock to arrive.
- Min/Max levels — If you have them and use them, it is good to pull these into the picture for a couple of reasons a) you can see whether a product stock levels are within the range or b) see if you need to adjust your stock levels when looking at the sales and monthly averages – sales may be picking up or slowing down, and you need to be aware of this for future planning.
- Lead Time — the time it takes to get to your warehouse once an order has been placed with the supplier. Very important when you are comparing your true stock coverage and how long it will take to get your SKU’s topped up to optimal stock coverage levels.
Check out the ultimate guide to inventory management software.
As you know, managing inventory levels is a dark art – part art & part science. So let's have a look at the scientific data-driven element. Using the above variables, we can now construct an equation that will help us with a day cover calculation.
It may vary from company to company, however, the process will look something like this:
Step 1 – calculate the true stock available (net stock levels)
(SOH + SOO + SIT) – (CS + BO) = Net Stock
Step 2 – calculate your average daily run rate using sales history
Total Unit Sales for 12 months/ 365 days = Avg. daily unit sales
Step 3 – calculate your stock coverage (in days)
Net Stock/ Avg. daily unit sales = Stock Coverage in days
So now that you can calculate your stock coverage in days (or months), you may want to compare this to your lead times (the time it takes to be received into your warehouse). For example, if your stock coverage is 28 days and it takes 84 days (12 weeks) for stock to be delivered, there is a good chance you’re going to be Out-of-Stock for 56 days (8 weeks) if unit sales continue on trend for that SKU. And Out-of-stock (OOS) means lost sales, dissatisfied customers and maybe no commissions for a Sales Manager.
The risks of using Excel to track stock coverage
No doubt, you will be performing these calculations and taking into consideration the stats as you apply the ‘part art’ to the process. This takes into consideration all the other subjective things going on in the business i.e. new product launches, other products superseding obsolete stock etc. However, how up to date is your Stock Coverage report? How flexible can you roll up to a product group level or isolate to a specific warehouse location? What happens if the supply chain suddenly comes under stress and you need to adjust your average inventory levels and update re-order points?
We often experience companies who use inventory management processes that rely on Excel and manual data manipulation. It takes people time to update stock reports so the business is slower to adapt to a changing supply chain.
The impact of inventory reporting software
What separates the amateurs from the professionals inventory manager is how easily and quickly they can access this stock coverage information when they use an integrated inventory analytics solution. It’s the professionals who access up-to-date information from multiple different systems without the need to cut and paste or further manipulate data in spreadsheets (every month). They can continue to interrogate the data with a point and click simplicity while they follow your train of thought. These people don’t have any concern about cell formulas from month to month because the software provides regular feeds of information that update the database automatically.
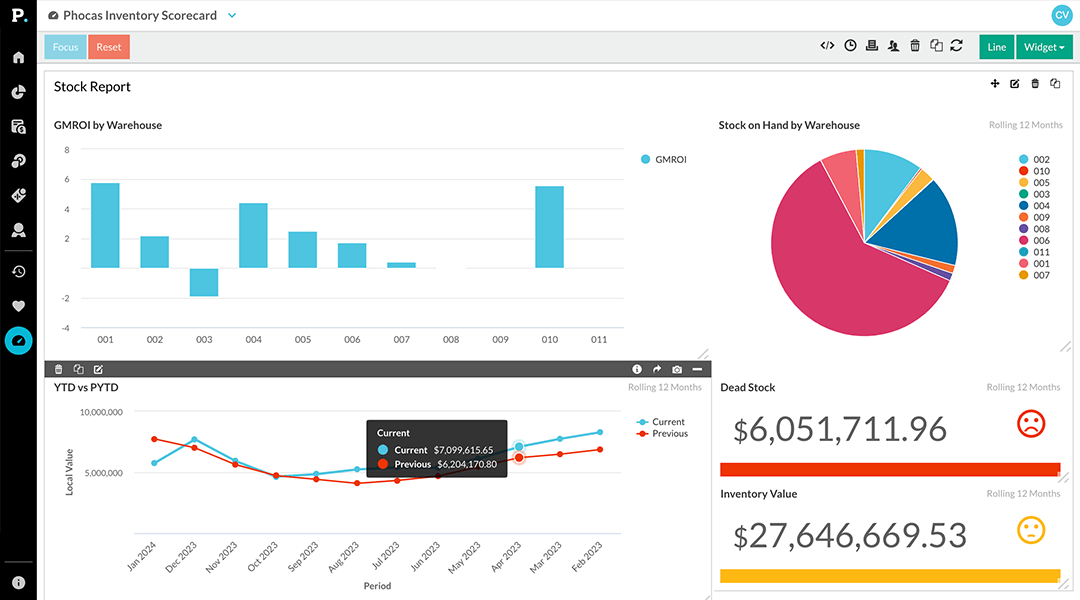 Dashboards give a high-level view of what’s happening with easy to read graphs and charts indicating potential red flags. If a product alert is indicating dangerous territory (a fall below a set margin threshold), people can drill down into the data and investigate further. Inventory and purchasing managers can save and share this information with others in the business, helping to avoid disappointing customers with accurate, transparent data of stock movements and expected delivery dates.
Automated inventory reporting to help you focus on what matters most
Business planning analytics software removes the hassle of keeping a spreadsheet up to date, removes the margin for error with incorrect cell references or formulas, so you can spend more time analyzing the stock situation and ensure that there are:
- No Out of Stock situations
- You don’t get caught with large ‘dead stock’ quantities
- You can identify easily ‘slow-moving’ stock before it becomes a problem
As well as measuring key metrics, inventory software also provides analysis and reporting capabilities, allowing stock businesses to gain valuable insights into inventory trends and enhance customer service. Leveraging automated inventory management software improves your accuracy and efficiency but also allows businesses to adapt quickly to market changes, ultimately enhancing overall operational effectiveness.
Learn more about measuring stock in this free ebook: Data-driven inventory optimization

Empowering businesses with intuitive data analytics, driving informed decisions for growth and profitability. We make people feel good about data.


Find out how our platform gives you the visibility you need to get more done.
Get your demo today