Confusion Matrix: Detailed intuition and trick to learn
Introduction
What is the first measure coming into your mind when you must test your classification model? Do you always check accuracy? Is accuracy enough to test the model?
In this read, you will get to know that accuracy is not the best measure to test your classification model, how can you draw more insight from your model, and can get a sense of how you can improve it. And, I will tell you one great trick to remember the mighty confusion Matrix, so that next time you won’t find it confusing. So, without further ado, let’s start!
We will be covering items here:
- Confusion Matrix: a simple definition
- TP and TPR
- TN and TNR
- FP and FPR
- FN and FNR
- Accuracy
- Error Rate
- General Understanding
- Why is the confusion matrix better than accuracy?
- Precision and Recall
- F1 Score
- Trick to remember confusion matrix
Confusion Matrix: a simple definition
As the name suggests, it is a matrix. A matrix of predicted and actual target values. This matrix compares the predicted target values with the actual target values. And it cannot process probability scores.
Let’s understand it with the help of a small dataset:
| Data points | Actual Class Labels | Predicted class labels |
| x1 | y1 | Y1 |
| x2 | y2 | Y2 |
| x3 | y3 | Y3 |
| . | . | . |
| . | . | . |
| . | . | . |
| xn | yn | Yn |
Here, x1,x2,x3……xn is the independent data points, y1,y2,y3…..yn are the actual target values or actual class labels, and Y1, Y2, Y3…..Yn has predicted class labels. Because the confusion matrix cannot process probability scores, all these class labels are binary.
Here every class label is either 0 or 1 (0 represents negative and 1 represents positive labels). So, the confusion matrix for a binary classification will be:
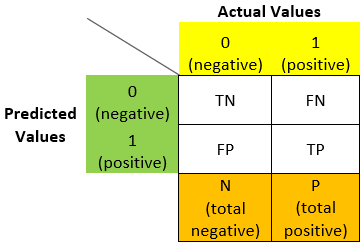
N = total negative
P = total positive
Here we can see how a confusion matrix looks like for a binary classification model. Now let’s understand TN, TP, FN, FP further.
True Positive (TP) and True Positive Rate (TPR):
True Positive – The predicted value as well as the actual value both are positive, i.e., the model correctly predicts the class label to be positive.
True Positive Rate – The ratio of true positive and totally positive, i.e.,
TPR = TP / P
TPR = TP / (FN+TP)
True Negative (TN) and True Negative Rate (TNR):
True Negative – The predicted value as well as the actual value both are negative, i.e., the model correctly predicts the class label to be negative.
True Negative Rate – The ratio of true negative and total negative, i.e.,
TNR = TN / N
TNR = TN / (TN+FP)
False Positive (FP) and False Positive Rate (FPR):
False Positive – The predicted value is positive, but the actual value was negative, i.e., the model falsely predicted these negative class labels to be positive.
False Positive Rate – The ratio of false-positive and total negative, i.e.,
FPR = FP / N
FPR = FP / (TN+FP)
NOTE: False positive (FP) is also called ‘type-1 error’.
False Negative (FN) and False Negative Rate (FNR):
False Negative – The predicted value is negative, but the actual value is positive, i.e., the model falsely predicted the positive class labels to be negative.
False Negative Rate – The ratio of false-negative and totally positive, i.e.,
FNR = FN / P
FNR = FN / (FN+TP)
NOTE: False negative (FN) is also called ‘type-2 error’.
Accuracy – The ratio of correctly predicted class labels to all class labels. It tells us how much our model is correct.
Accuracy = (TN+TP) / (N+P)
Error rate – The ratio of incorrectly predicted class labels to all class labels. It tells us how much our model has errored.
Error rate = (FN + FP) / (N+P)
General Understanding:
If the model is sensible and not dumb then,
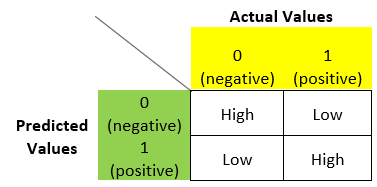
i.e., the elements in the principal diagonal in the matrix will be high and the rest of the off-diagonal elements will be small if the model is good or sensible.
So, by looking at the rates we have discussed above, we can conclude whether the model is dumb or sensible regardless it is balanced or imbalanced.
Why is the confusion matrix better than accuracy?
Let’s take a very simple example and understand it more deeply.
Suppose we have an imbalanced dataset that is 95% negative and 5% positive. So in this dataset, for any given ‘x’ we will have a negative ‘Y’ 95% of the time.
Let’s say after fitting the model our different rates are like this:
TP = 70, TN = 880, FP = 30, FN = 20
So, our accuracy will be:
Accuracy = (880+70) / (70+880+30+20)
Accuracy = 950 / 1000 = 0.95
i.e., 95%
We will think that the model is 95% accurate, i.e., it will predict accurately 95% of the time. But we can see here that it is a dumb model and 95% of the time it will say that the predicted value is negative.
We can overcome this problem by using precision and recall which are derived from the confusion matrix.
Now, I believe, you get my point, why accuracy is not the best matrix to measure our model performance.
Precision and Recall
Precision: Of all the points that the model predicted to be positive, how much percentage of them are truly positive?
Precision = TP / (FP+TP)
Recall: Of all the actually positive points how much percentage of them are predicted positive points?
Recall = TP / (FN+TP)
In most cases, we want both our precision and recall being high, but it is not possible. When our precision will be high our recall will be low and vice versa. So to balance these we have another matric called F1 Score.
F1 Score: It is the harmonic mean of precision and recall values. It is maximum when precision is equal to recall.
Trick to remember confusion matrix
Here is our confusion matrix:
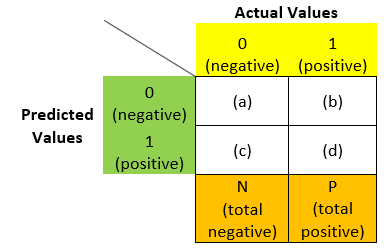
2 steps to remember:
- What is the predicted label? (the 2nd part)
- Are we correct? (the first part)
Let me elaborate. If we need to find (a) in the above matrix, we will ask ourselves what if the predicted label and write it in the 2nd place:
Now, we will ask the second question, i.e., are we correct? If yes, then we will write true (T) and if no, we will write false (F) and write it in the first place:
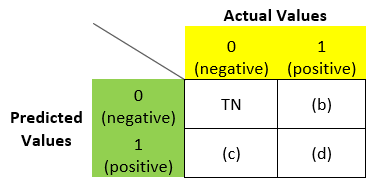
Similarly for (b), what is the predicted value? – N. Are we correct? – F. So in place of (b) we can write – FN:
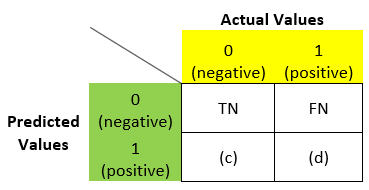
Similarly, we can fill (c) and (d) also:
Now how we can remember formulae for TPR, FPR, TNR, FNR:
TPR = number of true positives / total number of positives
So, the number of true positive points is – TP and the total number of positive points is – the sum of the column in which TP is present which is – P.
i.e.,
TPR = TP / P
TPR = TP / (FN+TP)
Similarly, we can see that,
TNR = TN / N
TNR = TN / (TN+FP)
Using the same trick, we can write FPR and FNR formulae.
So now, I believe you can understand the confusion matrix and different formulae related to it. How and why is it used and how it is better than accuracy? See, the confusion matrix is not very confusing anymore!
We will soon come with another article with some other tricks and in-depth intuition.
Stay Well!
The media shown in this article are not owned by Analytics Vidhya and is used at the Author’s discretion.


