Also known as a Starburst Plot or Bivariate Boxplot.
A Bagplot is a visualisation method used in robust statistics primarily designed for analysing two- or three-dimensional datasets. It was introduced by Peter Rousseeuw as an extension of the Box Plot methodology to accommodate multidimensional data.
The key purpose of a Bagplot is to provide a comprehensive understanding of various statistical properties of the dataset, including its location, spread, skewness, and identification of outliers. It achieves this by presenting the data through three distinct nested polygons: the bag, fence, and loop.
Source: Regression Depth for Statistical Depth Function
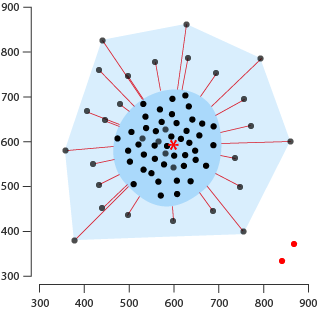
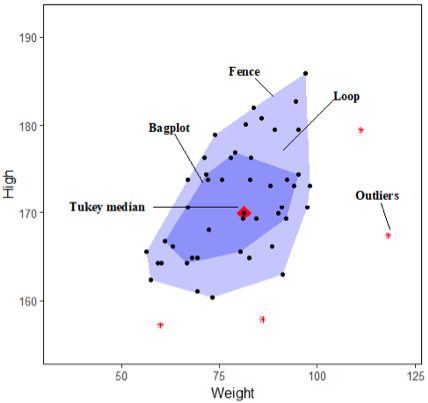
The innermost polygon, the bag (labelled bagplot above), is constructed based on the Tukey depth, which is essentially the smallest number of observations that can be contained by a half-plane that also includes a given point. The bag encompasses at most 50% of the data points, which provides a central representation of the dataset’s distribution.
Moving outward, the fence is formed by inflating the bag by a certain factor, typically three. This outer polygon delineates the boundaries beyond which observations are considered outliers. Points plotted outside the fence are flagged as potential anomalies or extreme values within the dataset.
The loop, surrounding the non-outlier observations within the fence, is essentially the convex hull of these points. It provides a visual delineation of the main body of the data, illustrating its shape and arrangement within the dataset.
Additionally, a Bagplot usually includes a depth median marked near the centre of the plot, represented by a symbol. This depth median signifies the point with the highest Tukey depth, providing a central reference point for the data distribution.
Outliers can represented as asterisks or are highlighted with red or another bright colour to make them visually more detectable.
To further enhance understanding, whiskers or line are often utilised to connect data points within the loop to the depth median. These elements help visualise the distribution of data points within the central region relative to their depth median.
Overall, the Bagplot offers a holistic and intuitive means of visualising complex datasets, facilitating deeper insights into their structure and characteristics across multiple dimensions. Its robustness makes it particularly useful in exploratory data analysis, outlier detection, and understanding the relationships between variables in multidimensional datasets.
Tools that can generate Bagplots:
R: Quick-R by datacamp, bcdudek.net, rdrr.io
wessa.net
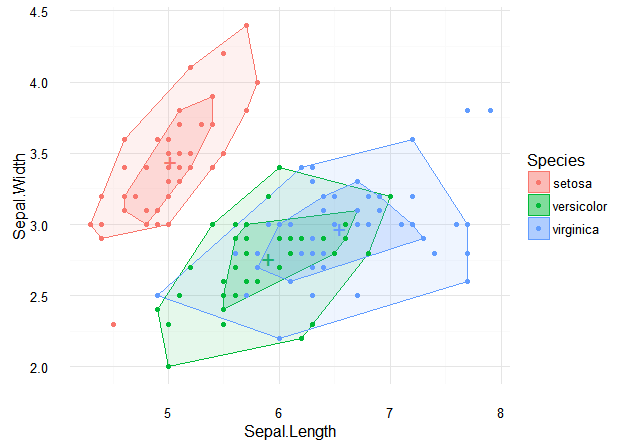
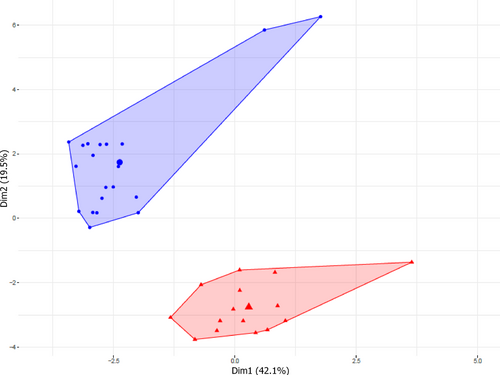
Examples
Figure 1. Car Weight and Engine Displacement of 60 Cars.
The Bagplot: A Bivariate Boxplot
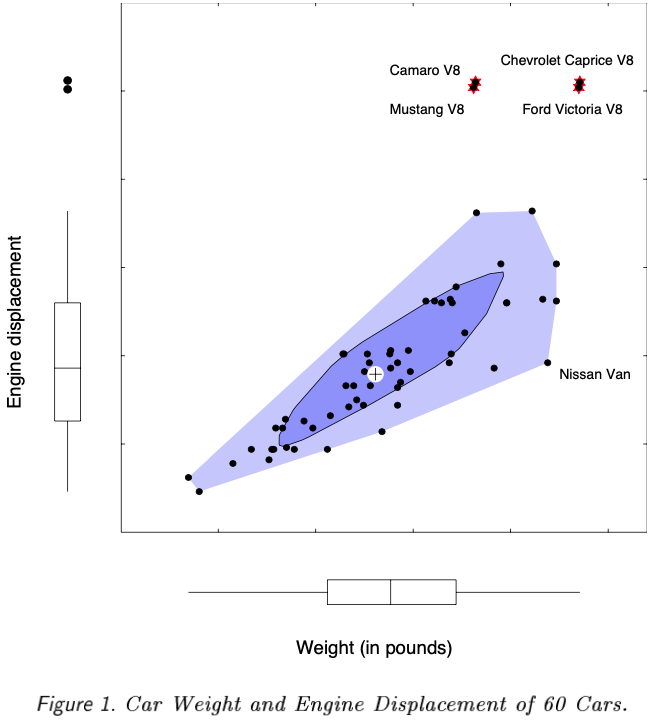
Figure 3. Part (a) shows the Concentrations of Cholesterol and Triglycerides in the Plasma of 320 Patients. In Part (b) Logarithms are taken of Both Variables.
The Bagplot: A Bivariate Boxplot
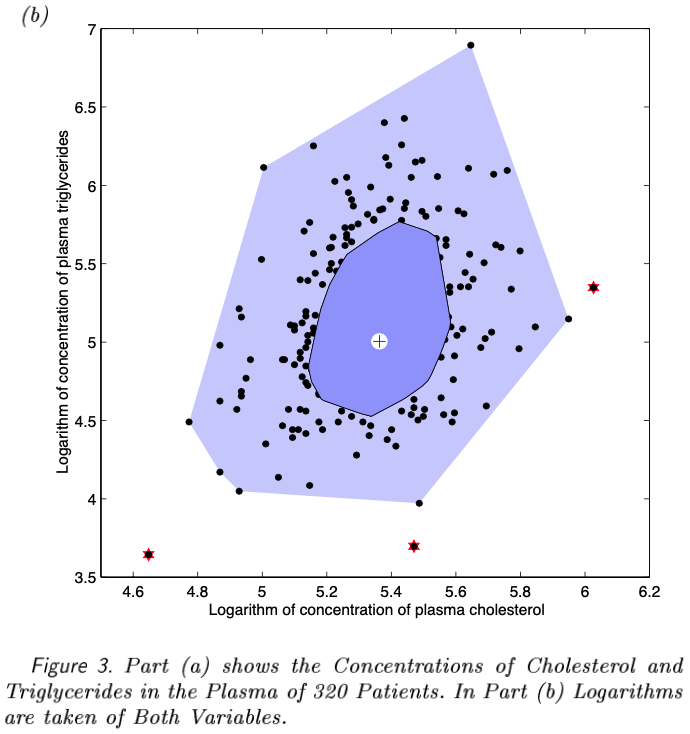
Figure 58.1.2, Bagplot of the heart and spleen size of 73 hamsters.
COMPUTATION OF ROBUST STATISTICS: DEPTH, MEDIAN, AND RELATED MEASURES
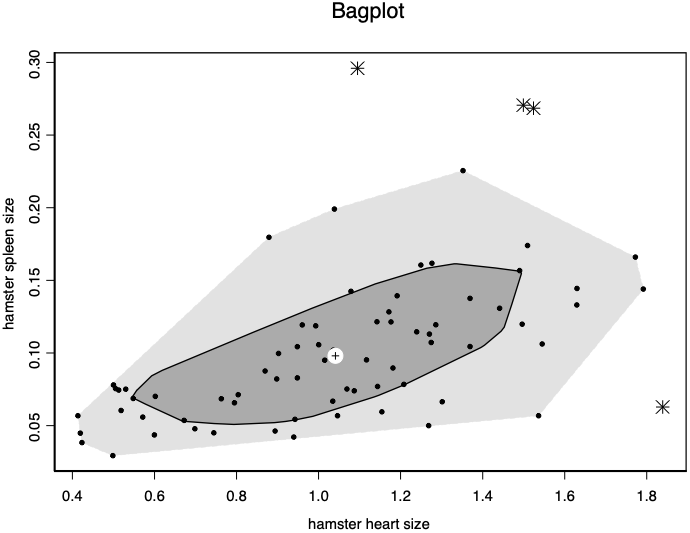
Figure 4. Tukey Bagplot. The 2D analogue representation of a Boxplot
Scatterplots are not always “trendy”, Daniel Zvinca
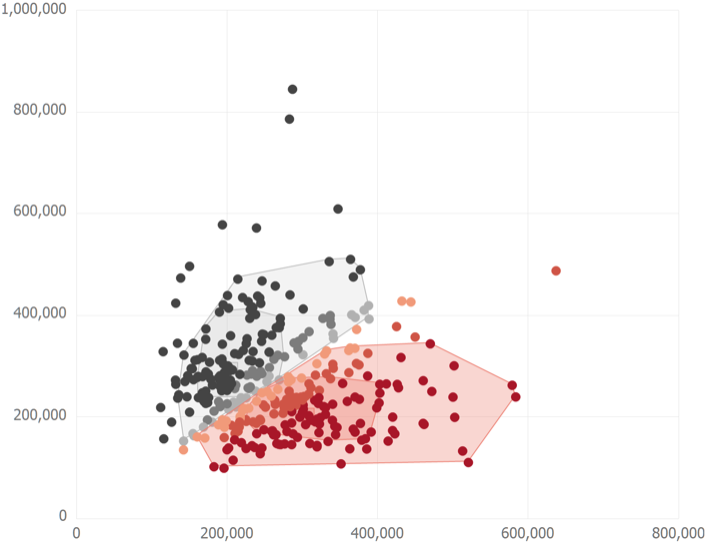
Figure 4, Differentiation in cuticular hydrocarbons between the two Anacamptis papilionacea ecotypes.
Do floral and ecogeographic isolation allow the co-occurrence of two ecotypes of Anacamptis papilionacea (Orchidaceae)?
Basic bagplot geom for ggplot2
Related posts:
Further Exploration #5 Multidimensional Boxplot Variations

