Classification Metrics Walkthrough: Logistic Regression with Accuracy, Precision, Recall, and ROC
In this article, I will be going through 4 common classification metrics: Accuracy, Precision, Recall, and ROC in relation to Logistic Regression.
Image by Editor
Metrics are an important element of machine learning. In regard to classification tasks, there are different types of metrics that allow you to assess the performance of machine learning models. However, it can be difficult to choose the right one for your task at hand.
In this article, I will be going through 4 common classification metrics: Accuracy, Precision, Recall, and ROC in relation to Logistic Regression.
Let's get started…
What is Logistic Regression?
Logistic Regression is a form of Supervised Learning - when the algorithm learns on a labeled dataset and analyses the training data. Logistic Regression is typically used for binary classification problems based on its ‘logistic function’.
Binary classification can represent their classes as either: positive/negative, 1/0, or True/False.
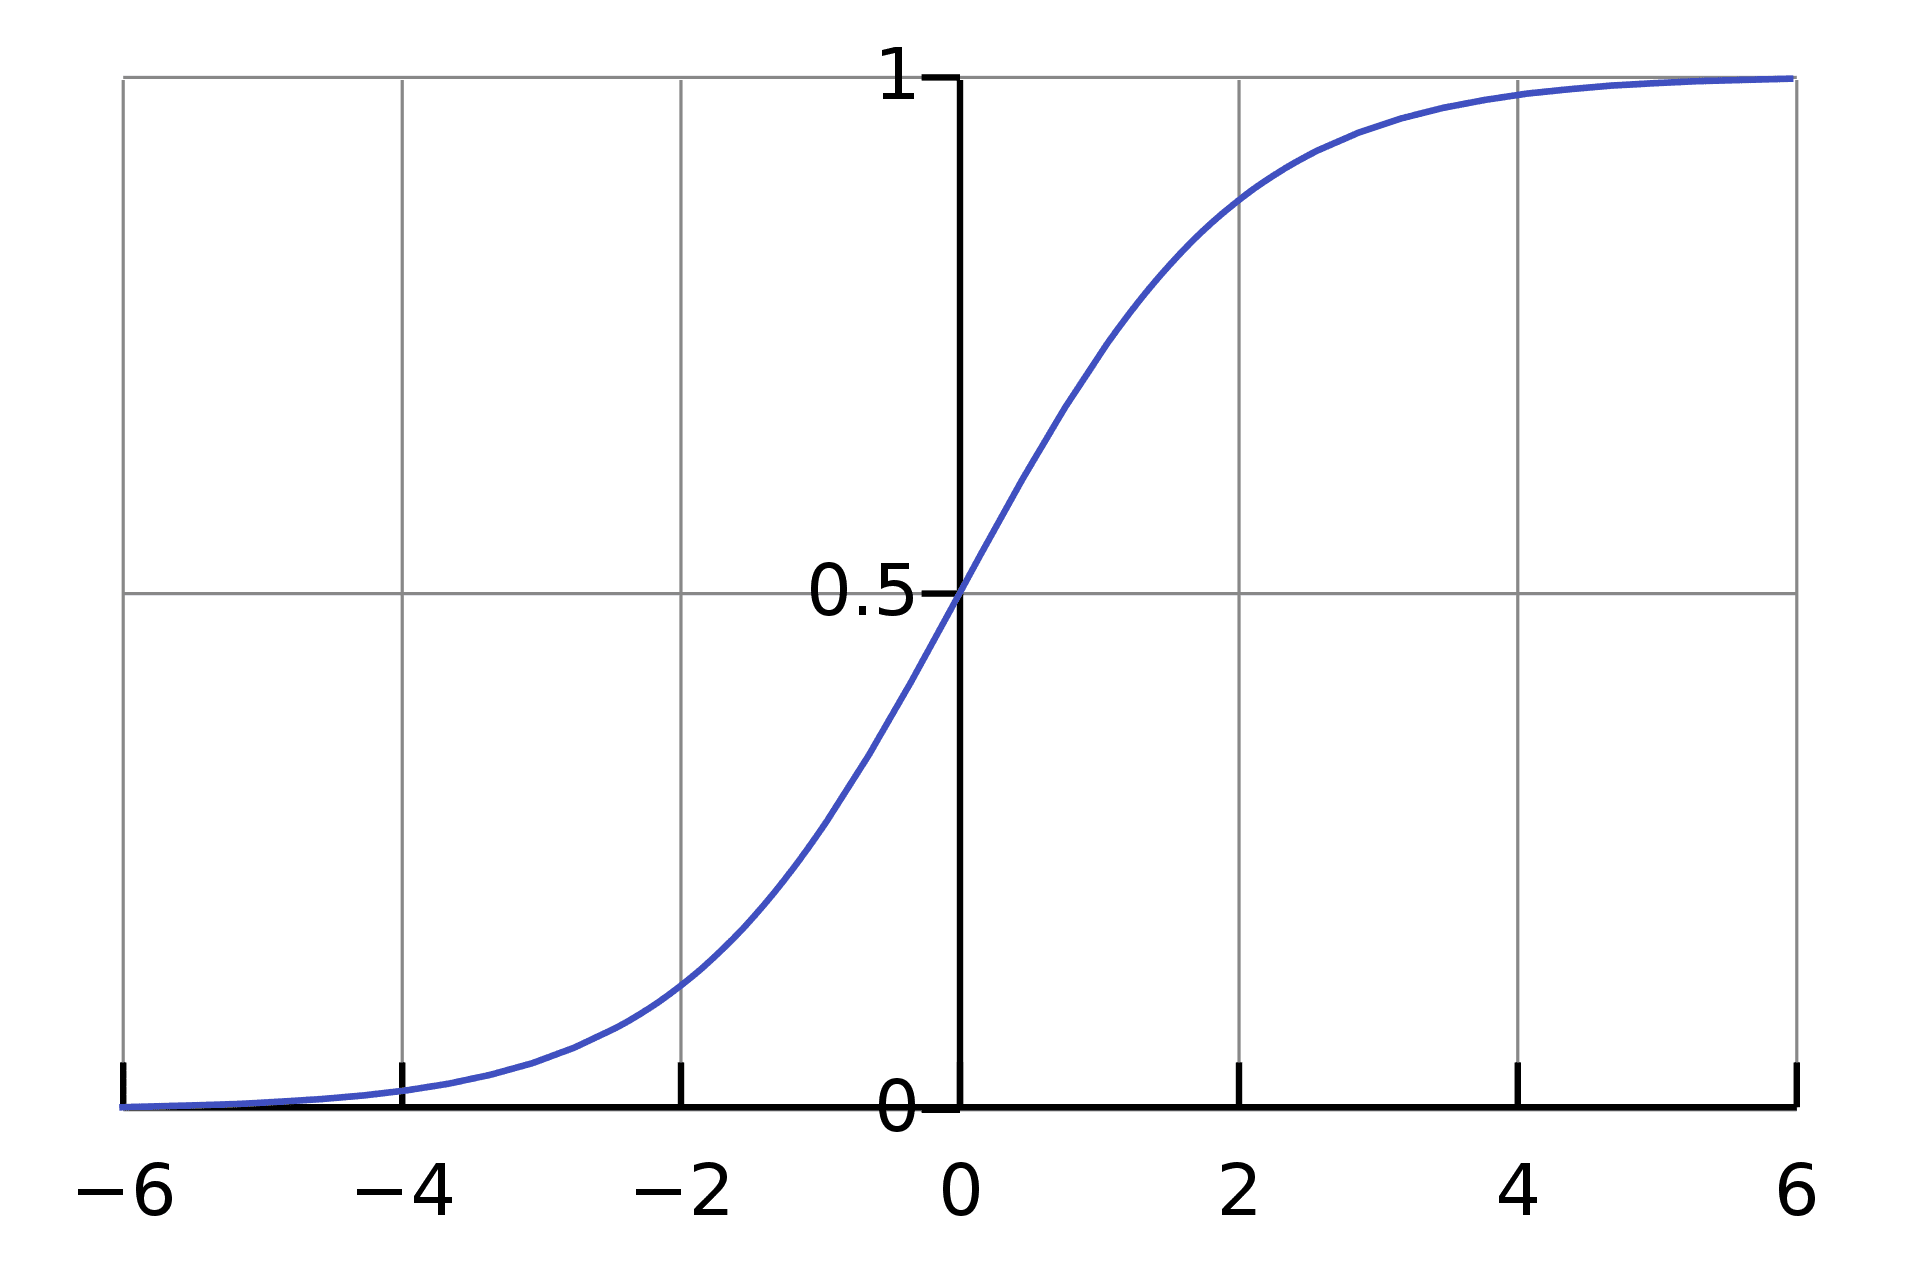
The logistic function is also known as the Sigmoid function which takes any real-valued number and maps it to a value between 0 and 1. It can be mathematically represented as:\
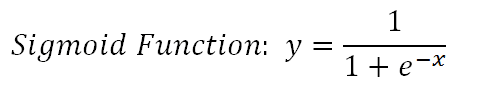
def sigmoid(z):
 return 1.0 / (1 + np.exp(-z))
Source: Wikipedia
What are Classification Metrics?
Classification is about predicting a label and then identifying which category an object belongs to based on different parameters.
In order to measure how well our classification model is doing at making these predictions, we use classification metrics. It measures the performance of our machine learning model, giving us the confidence that these outputs can be further used in decision-making processes.
The performance is normally presented in a range from 0 to 1, where a score of 1 represents perfection.
Problems with the threshold
If we use a range from 0 to 1 to represent the performance of our model, what happens when the value is 0.5? As we know from early math classes, if the probability is greater than 0.5, we round it up to 1 (positive) - if not, it is 0 (negative).
That sounds okay, but now when you are using classification models to help determine the output of real-life cases. We need to be 100% sure that the output has been correctly classified.
For example, logistic regression is used to detect spam emails. If the probability that the email is spam is based on the fact that it is above 0.5, this can be risky as we could potentially direct an important email into the spam folder. The want and need for the performance of the model to be highly accurate becomes more sensitive for health-related and financial tasks.
Therefore, using the threshold concept of values above the threshold value tend to be 1, and a value below the threshold value tends to be 0 can cause challenges.
Although there is the option to adjust the threshold value, it still raises the risk that we classify incorrectly. For example, having a low threshold will classify the majority of positive classes correctly, but within the positive will contain negative classes - vice versa if we had a high threshold.
So let’s get into how these classification metrics can help us with measuring the performance of our logistic regression model
Accuracy
We will start off with accuracy because it’s the one that’s typically used the most, especially for beginners.
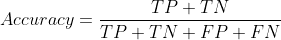
Accuracy is defined as the number of correct predictions over the total predictions:
accuracy = correct_predictions / total_predictions
However, we can further expand on this using these:
- True Positive (TP) - you predicted positive and it’s actually positive
- True Negative (TN) - you predicted negative and it’s actually negative
- False Positive (FP) - you predicted positive and it’s actually negative
- False Negative (FN) - you predicted negative and it’s actually positive
So we can say the true predictions are TN+TP, while the false prediction is FP+FN. The equation can now be redefined as:
In order to find the accuracy of your model, you would do this:
score = LogisticRegression.score(X_test, y_test)
print('Test Accuracy Score', score)
Or you can also use sklearn library:
from sklearn.metrics import accuracy_score
accuracy_score(y_train, y_pred)
However, using the accuracy metric to measure the performance of your model is usually not enough. This is where we need other metrics.
Precision and Recall
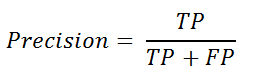
If we want to further test the “accuracy” in different classes where we want to ensure that when the model predicts positive, it is in fact true positive - we use precision. We can also call this Positive Prediction Value which can be defined as:
from sklearn.metrics import precision_score
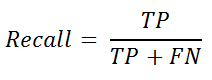
If we want to further test the “accuracy” in different classes where we want to ensure that when the model predicts negative, it actually is negative - we use recall. Recall is the same formula as sensitivity and can be defined as:
from sklearn.metrics import recall_score
Using both precision and recall are useful metrics when there is an imbalance in the observations between the two classes. For example, there are more of one class (1) and only a few of the other class (0) in the dataset.
In order to increase the precision of your model, you will need to have fewer FP and not have to worry about the FN. Whereas, if you want to increase recall, you will need to have fewer FN and not have to worry about the FP.
Raising the classification threshold reduces false positives - increasing precision. Raising the classification threshold reduces true positives or keeps them the same, whilst increasing false negatives or keeps them the same. - decreasing recall or keeping it constant.
Unfortunately, it’s not possible to have a high precision and recall value. If you increase precision, it will reduce recall - vice versa. This is known as the precision/recall tradeoff.
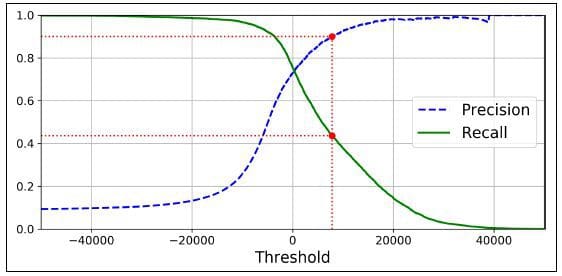
Source: Medium
ROC Curve
When it comes to precision we care about lowering the FP and for recall we care about lowering the FN. However, there is a metric that we can use to lower both the FP and FN - it is called the Receiver Operating Characteristic curve, or ROC curve.
It plots the false positive rate (x-axis) against the true positive rate (y-axis).
- True Positive Rate = TP / (TP + FN)
- False Positive Rate = FP / (FP + TN)
The true positive rate is also known as sensitivity, and the false positive rate is also known as the inverted specificity rate.
- Specificity = TN / (TN + FP)
If the values on the x-axis consist of smaller values, this indicates lower FP and higher TN. If the values on the y-axis consist of larger values, this indicates higher TP and lower FN.
The ROC presents the performance of a classification model at all classification thresholds, like this:
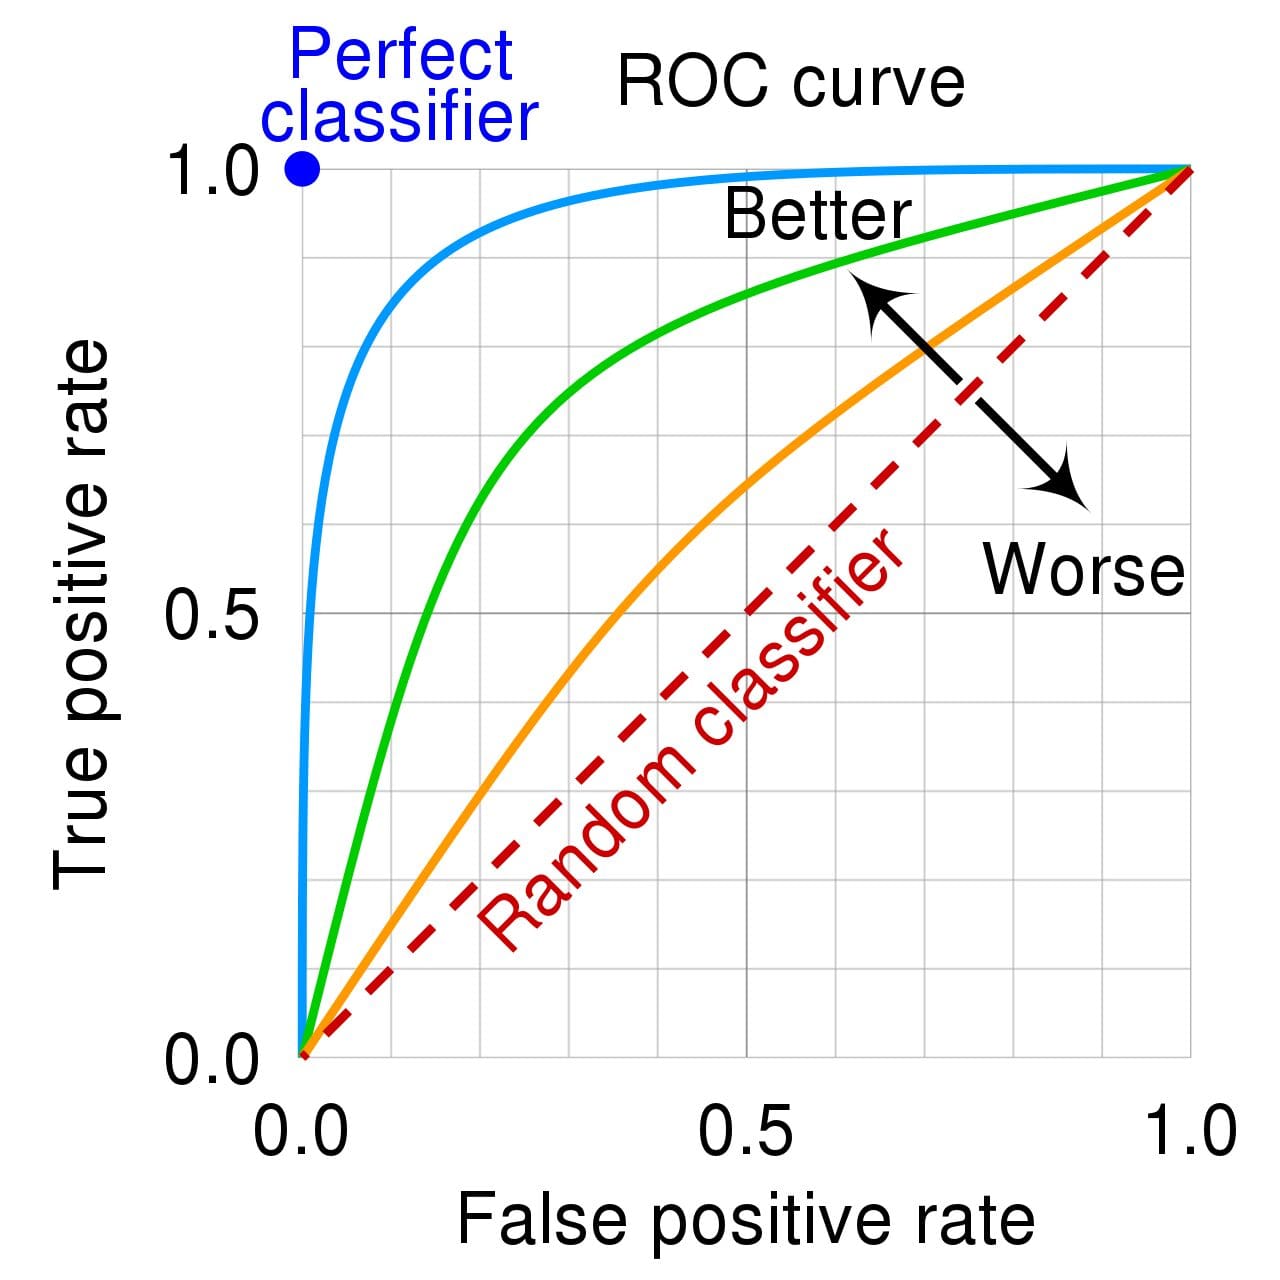
Source: Wikipedia
Example:
AUC
When it comes to the ROC curve, you may have also heard Area Under the Curve (AUC). It’s exactly what it says it is - the area under the curve. If you want to know how good your curve is, you calculate the ROC AUC score. ??AUC measures the performance across all possible classification thresholds.
The more area under the curve you have, the better - the higher the ROC AUC score. This is when the FN and FP are both at zero - or if we refer to the graph above, it’s when the true positive rate is 1 and the false positive rate is 0.
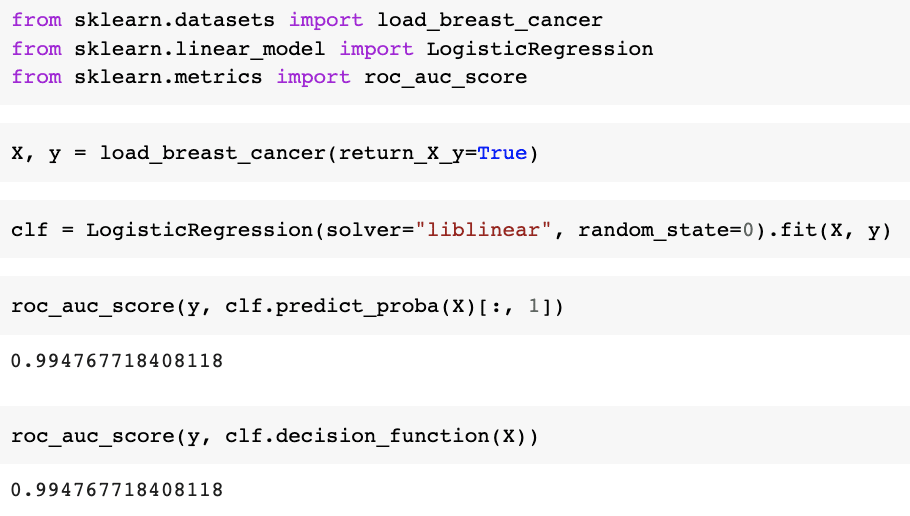
from sklearn.metrics import roc_auc_score
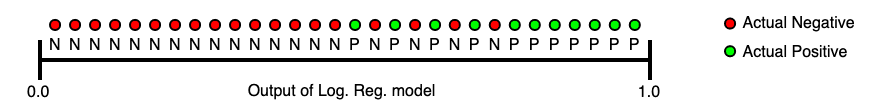
The below image shows an ascending order of logistic regression predictions. If the AUC value is 0.0, we can say that the predictions are completely wrong. If the AUC value is 1.0, we can say that the predictions are fully correct.
Wrapping it up
To recap, we have gone over what is Logistic Regression, what Classification Metrics are, and problems with the threshold with solutions, such as Accuracy, Precision, Recall, and the ROC Curve.
There are so many more classification metrics out there, such as confusion matrix, F1 score, F2 score, and more. These are all available to help you better understand the performance of your model.
Nisha Arya is a Data Scientist and Freelance Technical Writer. She is particularly interested in providing Data Science career advice or tutorials and theory based knowledge around Data Science. She also wishes to explore the different ways Artificial Intelligence is/can benefit the longevity of human life. A keen learner, seeking to broaden her tech knowledge and writing skills, whilst helping guide others.