What is the Difference Between Covariance and Correlation?
Introduction
Comprehending and unleashing the intricate affinities among variables in the expansive realm of statistics is integral.
Everything from data-driven decision-making to scientific discoveries to predictive modeling depends on our potential to disentangle the hidden connections and patterns within complex datasets. Among various statistical standards supporting this pursuit, covariance and correlation are crucial, rendering insights into the independencies between variables.
Covariance and correlation are frequently occurring variables in statistical analysis, yet people often misunderstand or use them interchangeably. The subtle nuances differentiating these two standards can profoundly impact our interpretation and utilization of statistical relationships.
Therefore, understanding the true nature of covariance and correlation is paramount for any data enthusiast or professional striving to unveil the full potential of their data.
This blog- covariance vs correlation- will discuss the differences between these two statistical concepts and demystify their relationship.
Also, fuel your data science career by upgrading your skills with Analytics Vidhya’s Learn Swift for Data Science course.
Table of contents
- Covariance
- Correlation
- Advantages and Disadvantages of Covariance
- Advantages and Disadvantages of Correlation
- Similarities between Covariance and Correlation
- Differences between Covariance and Correlation
- Use Cases and Examples
- Real-World Examples and Applications of Covariance and Correlation
- Points to Consider While Choosing Between Covariance and Correlation
- Conclusion
- Frequently Asked Questions
Covariance
It’s a statistical term demonstrating a systematic association between two random variables, where the change in the other mirrors the change in one variable.
Definition and Calculation of Covariance
Covariance implies whether the two variables are directly or inversely proportional.
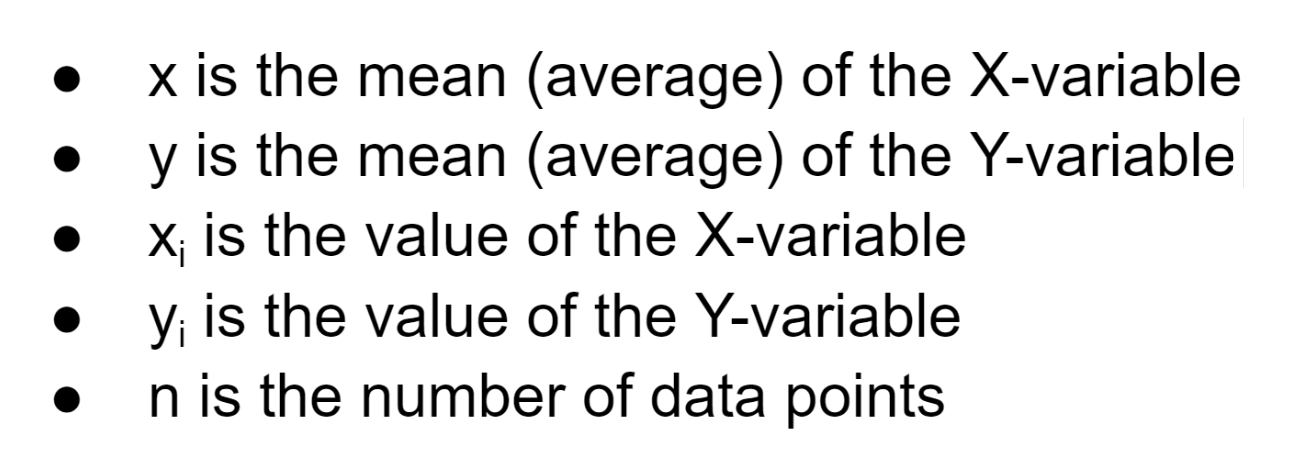
The covariance formula determines data points in a dataset from their average value. For instance, you can compute the Covariance between two random variables, X and Y, using the following formula:

In the above procedure,
Interpreting Covariance Values
Covariance values indicate the magnitude and direction (positive or negative) of the relationship between variables. The covariance values range from -∞ to +∞. The positive value implies a positive relationship, whereas the negative value represents a negative relationship.
Positive, Negative, and Zero Covariance
The higher the number, the more reliant the relationship between the variables. Let’s comprehend each variance type individually:
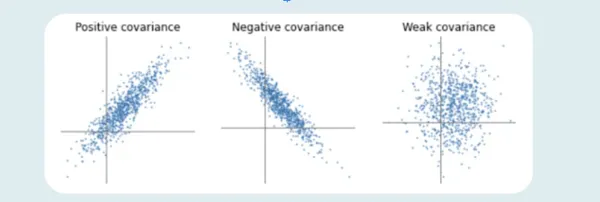
Positive Covariance
If the relationship between the two variables is a positive covariance, they are progressing in the same direction. It represents a direct relationship between the variables. Hence, the variables will behave similarly.
The relationship between the variables will be positive Covariance only if the values of one variable (smaller or more significant) are equal to the importance of another variable.
Negative Covariance
A negative number represents negative Covariance between two random variables. It implies that the variables will share an inverse relationship. In negative Covariance, the variables move in the opposite direction.
In contrast to the positive Covariance, the greater of one variable correspond to the smaller value of another variable and vice versa.
Zero Covariance
Zero Covariance indicates no relationship between two variables.
Significance of Covariance in Assessing Linear Relationship
Covariance is significant in determining the linear relationship between variables. It suggests the direction (negative or positive) and magnitude of the relationship between variables.
A higher covariance value indicates a strong linear relationship between the variables, while a zero covariance suggests no ties.
Limitations and Considerations of Covariance
The scales of measurements influence the Covariance and are highly affected by outliers. Covariance is restricted to measuring only the linear relationships and doesn’t apprehend the direction or strength.
Moreover, comparing covariances across various datasets demand caution due to different variable ranges.
Correlation
Unlike Covariance, correlation tells us the direction and strength of the relationship between multiple variables. Correlation assesses the extent to which two or more random variables progress in sequence.
Definition and Calculation of Correlation Coefficient
Correlation is a statistical concept determining the relationship potency of two numerical variables. While deducing the relation between variables, we conclude the change in one variable that impacts a difference in another.
When an analogous movement of another variable reciprocates the progression of one variable in some manner or another throughout the study of two variables, the variables are correlated.
The formula for calculating the correlation coefficient is as follows:
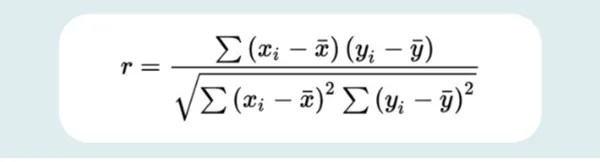
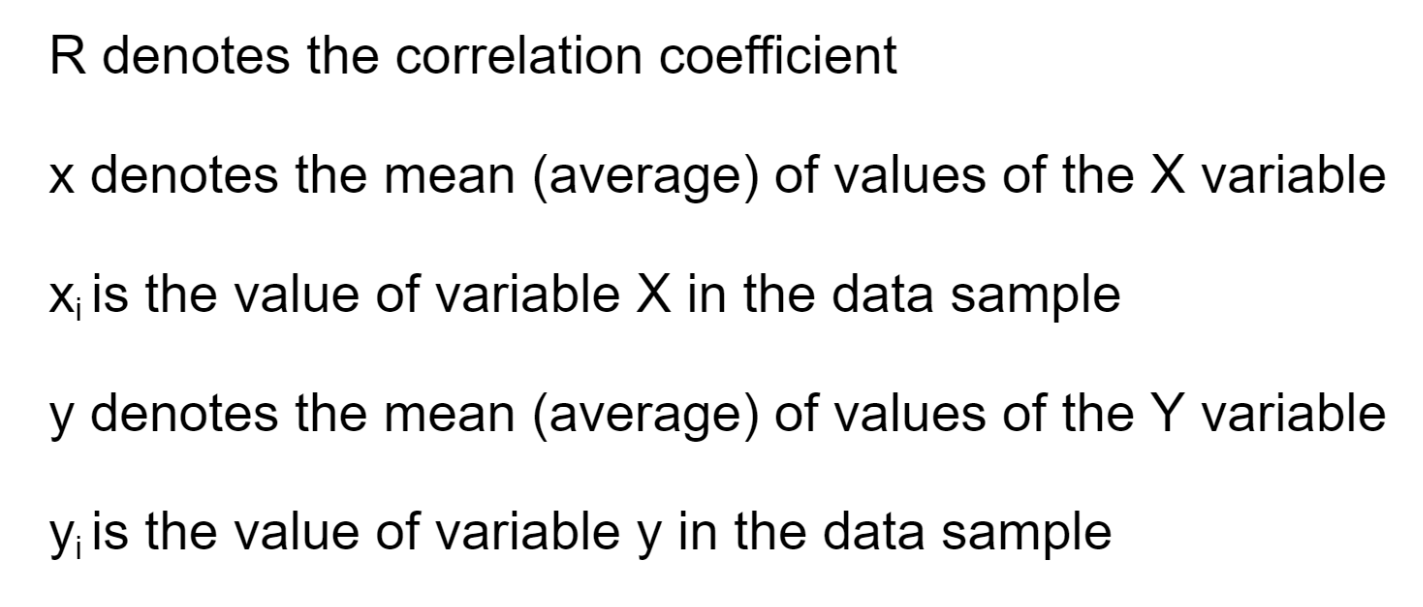
Where,
Interpreting Correlation Values
There are three types of correlation based on diverse values. Negative correlation, positive correlation, and no or zero correlation.
Positive, Negative, and Zero Correlation
If the variables are directly proportional to one another, the two variables are said to hold a positive correlation. This implies that if one variable’s value rises, the other’s value will exceed. An ideal positive correlation possesses a value of 1.
Here’s what a positive correlation looks like:
In a negative correlation, one variable’s value increases while the second one’s value decreases. A perfect negative correlation has a value of -1.
The negative correlation appears as follows:

Just like in the case of Covariance, a zero correlation means no relation between the variables. Therefore, whether one variable increases or decreases won’t affect the other variable.
Strength and Direction of Correlation
Correlation assesses the direction and strength of a linear relationship between multiple variables. The correlation coefficient varies from -1 to 1, with values near -1 or 1 implying a high association (negative or positive, respectively) and values near 0 suggesting a weak or no correlation.
Pearson Correlation Coefficient and Its Properties
The Pearson correlation coefficient (r) measures the linear connection between two variables. The properties of the Pearson correlation coefficient include the following:
- Strength: The coefficient’s absolute value indicates the relationship’s strength. The closer the value of the coefficient is to 1, the stronger the correlation between variables. However, a value nearer to 0 represents a weaker association.
- Direction: The coefficient’s sign denotes the direction of the relationship. If the value is positive, there is a positive correlation between the two variables, which means that if one variable rises, the other will also rise. If the value is negative, there is a negative correlation, which suggests that when one variable increases, the other will fall.
- Range: The coefficient’s content varies from -1 to 1. The perfect linear relationship is represented by several -1, the absence of a linear relationship is represented by 0, and an ideal linear relationship is denoted by a value of 1.
- Independence: The Pearson correlation coefficient quantifies how linearly dependent two variables are but does not imply causality. There is no guarantee that a strong correlation indicates a cause-and-effect connection.
- Linearity: The Pearson correlation coefficient only assesses linear relationships between variables. The coefficient could be insufficient to describe non-linear connections fully.
- Sensitivity to Outliers: Outliers in the data might influence the correlation coefficient’s value, thereby boosting or deflating its size.
If you want hands-on experience working on Data Science projects, explore a comprehensive program by Analytics Vidhya on Top Data Science Projects for Analysts and Data Scientists.
Other Types of Correlation Coefficients
Other correlation coefficients are:
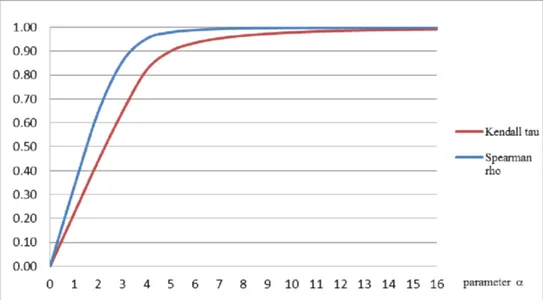
- Spearman’s Rank Correlation: It’s a nonparametric indicator of rank correlation or the statistical dependency between the ranks of two variables. It evaluates how effectively a monotonic function can capture the connection between two variables.
- Kendall Rank Correlation: A statistic determines the ordinal relationship between two measured values. It represents the similarity of the data orderings when ordered by each quantity, which is a measure of rank correlation.
An image of an anti-symmetric family of copulas’ Spearman rank correlation and Kendall’s tau are inherently odd parameter functions.
Advantages and Disadvantages of Covariance
Following are the advantages and disadvantages of Covariance:
Advantages
- Easy to Calculate: Calculating covariance doesn’t require any assumptions of the underlying data distribution. Hence, it’s easy to calculate covariance with the formula given above.
- Apprehends Relationship: Covariance gauges the extent of linear association between variables, furnishing information about the relationship’s magnitude and direction (positive or negative).
- Beneficial in Portfolio Analysis: Covariance is typically employed in portfolio analysis to evaluate the diversification advantages of integrating different assets.
Disadvantages
- Restricted to Linear Relationships: Covariance only gauges linear relationships between variables and does not capture non-linear associations.
- Doesn’t Offer Relationship Magnitude: Covariance doesn’t offer a standardized estimation of the intensity or strength of the relationship between variables.
- Scale Dependency: Covariance is affected by the variables’ measurement scales, making comparing covariances across various datasets or variables with distinct units challenging.
Advantages and Disadvantages of Correlation
The advantages and disadvantages of correlation are as follows:
Advantages
- Determining Non-Linear Relationships: While correlation primarily estimates linear relationships, it can also demonstrate the presence of non-linear connections, especially when using alternative correlation standards like Spearman’s rank correlation coefficient.
- Standardized Criterion: Correlation coefficients, such as the Pearson correlation coefficient, are standardized, varying from -1 to 1. This allows for easy comparison and interpretation of the direction and strength of relationships across different datasets.
- Robustness to Outliers: Correlation coefficients are typically less sensitive to outliers than Covariance, delivering a more potent standard of the association between variables.
- Scale Independencies: Correlation is not affected by the measurement scales, making it convenient for comparing affinities between variables with distinct units or scales.
Disadvantages
- Driven by Extreme Values: Extreme values can still affect the correlation coefficient, even though it is less susceptible to outliers than Covariance.
- Data Requirements: Correlation assumes that the data is distributed according to a bivariate normal distribution, which may not always be accurate.
- Limited to Bivariate Analysis: Because correlation only examines the connection between two variables simultaneously, it can only capture simple multivariate correlations.
Similarities between Covariance and Correlation
Covariance vs correlation sure has several differences, but they have similarities too. Some of the similarities are as follows:
Indicators of the Relationship between Variables
Correlation and Covariance both gauge just the linear relationship between variables. This implies that if the correlation coefficient is zero, so will the Covariance. Even the change in location doesn’t affect the correlation and covariance standards.
The Measure of Linear Association
Both Covariance and correlation are measures used to assess the relationship between variables. They offer clarity on how variables are linked to one another.
Calculations Using the Same Variables
The calculation of Covariance and correlation both require the same set of variables. They need
Covariance and correlation calculations involve the same set of variables. They require paired observations of the variables of interest to determine their relationship.
However, if it’s about choosing between Covariance and correlation to reckon the relationship between variables, experts always prefer correlation over Covariance because the change in scale doesn’t affect correlation.
Differences between Covariance and Correlation
While both of them are statistical terms, Covariance and correlation differ from each other on various grounds.
Interpretation and Scale of Values
The change in scale changes the value of Covariance. A higher number in Covariance means higher dependency. Interpreting Covariance is difficult.
On the contrary, the correlation value remains unaffected by the change in scale. The correlation coefficients range from -1 to 1, which allows for a more straightforward interpretation, unlike Covariance.
Relationship to the Units of Measurement
The variables’ measurement units affect Covariance, making comparing covariance values across various datasets or variables with different units challenging.
On the other hand, correlation coefficients don’t have any units and do not rely on the units of measurement, allowing comparisons between variables with various units.
Standardization and Comparison Across Datasets
Since Covariance doesn’t have standardization, comparing covariances across various datasets is challenging. While correlation coefficients are standardized. Therefore, comparing it directly across variables, datasets, or contexts is easy.
Robustness to Outliers
Outlier hugely impacts the value of Covariance. Hence, it is sensitive to the presence of outliers. On the contrary, correlation coefficients offer a more robust standard of the relationship between variables, as correlation coefficients are less susceptible to outliers.
Usage in Different Contexts and Applications
Covariance has applications in the following:
- Biology — Molecular and Genetics to gauge specific DNAs.
- Estimating the invested amount on different assets in financial markets.
- Collecting data procured from oceanographic/astronomical studies to conclude.
- Examining a dataset with logical implications of the principal element.
- Studying signals obtained in different forms.
On the other hand, the correlation has the following applications:
- Employed in pattern recognition
- Measures the relationship between poverty and population
- Analyzes temperature rise during summer v/s water consumption among family members
- Estimates the time vs. money a customer has spent on an online e-commerce website
- Compares the past weather forecast reports to the current year.
To summarize the differences, here’s a table you must glance through:
| Difference Grounds | Covariance | Correlation |
| Meaning | Covariance means two variables directly or inversely depend on one another. | Two variables are said to be in correlation if the change in one affects the other variable. |
| Values | Lie between -infinity to +infinity | Values lie between -1 to 1 |
| Unit | It’s a product of the unit of variables | It’s a unit-free measure |
| Change in Scale | Even minor changes in scale affect Covariance | There won’t be any change in correlation because of the scale |
| Measure of | Correlation | The scaled version of Covariance |
| Application | Market Research, Portfolio Analysis, and Risk Assistance | Medical Research, Data Analysis, and Forecasting |
Use Cases and Examples
Given below are some practical applications and examples of Covariance vs Correlation:
Practical Scenarios Where Covariance is Useful
There are three practical scenarios where Covariance proves beneficial:
- Market Research: Covariance is employed in market research for analyzing the link between variables, such as sales revenue and advertising expenditure, to comprehend the influence of marketing endeavors on business outcomes.
- Risk Assessment: Covariance helps in risk management and risk assessment. For instance, in insurance, Covariance can help identify the association between distinct variables (such as claims frequency, health conditions, and age) to assess potential losses and set appropriate premiums.
- Portfolio Analysis: Covariance has a profound application in finance for evaluating the relationship between different asset returns within a portfolio. A positive covariance means that the assets will move in the same direction, while a negative one indicates that they will go in opposite directions. Such information is helpful in portfolio diversification for managing risk.
Practical Scenarios Where Correlation is Useful
Some practical cases of correlation include forecasting, data analysis, and medical research.
- Forecasting: Correlations aid forecasters in determining the degree to which they can predict one variable based on the values of another variable. For example, correlation in sales forecasting can be beneficial in foretelling future sales based on previous sales records.
- Analysis of Data: Data enthusiasts use correlation popularly to quantify and identify relationships between variables. For instance, in social sciences, correlation can help determine the link between variables like education level or income or between productivity and job satisfaction.
- Medical Research: In medical research, correlations help find associations between variables, like the correlation between lung cancer and smoking or the correlation between the risk of cardiovascular diseases and the BMI (body mass index).
Real-World Examples and Applications of Covariance and Correlation
While the applications of Covariance and correlation have been described above, some real-world examples of the same are as follows:
Covariances are used extensively in finance and present-day portfolio theory. For instance, the Covariance between security and the market are utilized in the calculation for one of the model’s key variables, beta, in the capital asset pricing model (CAPM), which determines the expected return on an asset.
In the CAPM, beta quantifies an asset’s volatility, or systematic risk, compared to the whole market; it’s a valuable metric that uses Covariance to determine an investor’s risk exposure particular to one investment.
Examples of Correlation include the time spent running vs. the body fat. The more time a person spends jogging, the less body fat they have. In other words, a negative relationship exists between variable running time and variable body fat. Body fat lowers as running time rises.
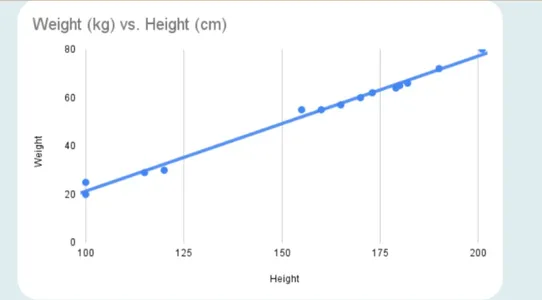
Another instance includes body weight vs. height. The relationship between an individual’s size and weight is usually upbeat. In other words, those who are taller tend to weigh more.
Points to Consider While Choosing Between Covariance and Correlation
Before concluding or picking Covariance or correlation, you must keep the following into consideration:
1. Considerations for the Research Question or Objective
Focus on your requirements. Whatever you choose must go with the specific objective or research question. If you aim to estimate the direction and strength of the linear association between variables, then selecting the correlation will be wise. However, if you desire to measure the extent of a relationship without any interpretation, go for Covariance.
2. Nature of the Variables and Underlying Assumptions
The next point to consider is the nature of the variables you are examining and the assumptions for each measure. The Correlation has no unit; it’s unitless and embraces a linear association between variables. However, Covariance focuses on the basic units and is sensitive to the scale.
3. Availability of Data and Measurement Scale
Do not forget to assess the variable’s measurement scale and the available data. While Covariance demands paired observations of the variables, the correlation needs a similar and bivariate normality assumption.
4. Importance of Standardized Interpretation or Comparison
You must analyze the need for comparison or standardized interpretation across various variables or sets of data. If the comparison is essential, the standardized range of correlation varies from -1 to 1, allowing for simple comparison and interpretation.
5. Applicability in the Specific Analysis or Field
You must choose a particular analysis or field of research. While Covariance is applicable in market research, risk assessment, and finance, correlation is employed in forecasting, data analysis, and social sciences.
Conclusion
Understanding the differences between Covariance and correlation is significant. Covariance measures the degree of linear relationship, while correlation offers a standardized measurement that also considers the direction and strength of the relationship.
Covariance vs correlation has several grounds for differentiation, such as standardization, interpretation, scale, sensitivity to outliers, and applications in various terms. While they differ significantly, they do share some similarities as well. They are indicators of the relationship between variables and measures of linear association.
Choosing an appropriate measure is crucial. It should be based on specific requirements and the context of the analysis. Covariance is beneficial in market research, risk assessment, portfolio analysis, and more. In contrast, correlation is helpful in medical research, forecasting, data analysis, and other areas.
Why not do it with experts if you want to accelerate your career? Explore Analytics Vidhya’s Data Science Hacks, Tips, and Tricks course to sharpen your data science skills and grab a rewarding career as a data scientist.
Frequently Asked Questions
A. A positive covariance implies that two variables are moving in the same direction. It indicates a direct link between the variables. It means if the value of one variable is more excellent, the value of another variable will also be similar.
A. The negative Covariance suggests that the variables will share an inverse relationship. In negative Covariance, the variables progress in the opposite direction. This also means that if one value has an above-average value, the other will have a below-average value.
A. The correlation coefficient of 1 means an ideal positive linear relationship between the variables. It suggests that if one variable increases, another one will also increase.
A. A correlation coefficient of 0 suggests no linear association between the variables. It means that even if one variable changes, another will remain unaffected.
A. Covariance and correlation matrices offer insights into the relationships between various variables in a data set.


