article thumbnail

7 Tools to Create Engaging Presentations

Analytics Vidhya

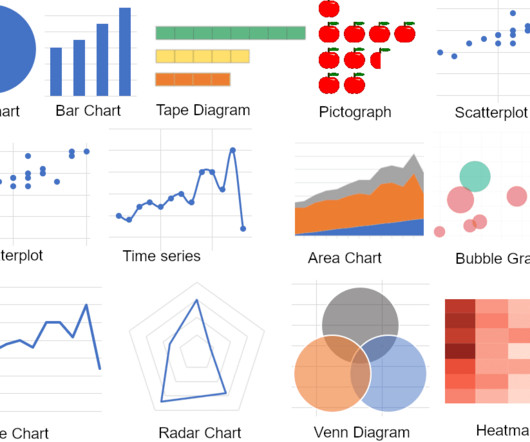
Introduction Visual presentations are indispensable for effective communication. Whether you’re a student, professional, or entrepreneur, mastering the art of crafting engaging and informative presentations is vital.

article thumbnail

PowerPoint Presentations Made East With GAMMA

Analytics Vidhya

Introduction PowerPoint has long been the reigning champion in creating presentations for clients or other important meetings. It is a web-based presentation builder that utilizes AI to help you create compelling and visually engaging presentations in minutes.

Insiders

Sign Up for our Newsletter

This site is protected by reCAPTCHA and the Google Privacy Policy and Terms of Service apply.

Trending Sources

article thumbnail

You can now Create Stunning Presentations using Tome AI

Analytics Vidhya

Say goodbye to tedious manual work and hello to a smarter way of presentation making. In this guide, we’ll explore how you can use Tome AI, a powerful tool fueled by artificial intelligence, to generate stunning AI presentations effortlessly. What is Tome AI?

Analytics 276
article thumbnail

11 Outstanding Papers Presented at NeurIPS 2023

Analytics Vidhya

The rigorous review process, conducted by over 1,100 Area Chairs, 100 senior area chairs, and 396 Ethics reviewers, led to the […] The post 11 Outstanding Papers Presented at NeurIPS 2023 appeared first on Analytics Vidhya. This year’s conference attracted a record-breaking 13,321 submissions.

article thumbnail

Data Analytics in the Cloud for Developers and Founders

Speaker: Javier Ramírez, Senior AWS Developer Advocate, AWS

Javier Ramirez will present: The typical steps for building a data lake. Is your data secure? In this session, we address common pitfalls of building data lakes and show how AWS can help you manage data and analytics more efficiently. A live demo of lake formation. Navigating idle clusters and bottlenecks.

article thumbnail

An AI-Generated News Presenter, Fedha Welcomes You in Kuwait!

Analytics Vidhya

An AI-Generated news presenter has been introduced by Kuwait News, an online news organization connected to the Kuwait Times. The outlet’s Twitter account published […] The post An AI-Generated News Presenter, Fedha Welcomes You in Kuwait! appeared first on Analytics Vidhya.

article thumbnail

AI Pioneer Fei-Fei Li: Navigating the Present and Future of AI

Analytics Vidhya

As a co-director of Stanford’s Institute for Human-Centered Artificial Intelligence (HAI), she’s passionately working towards enhancing AI research, […] The post AI Pioneer Fei-Fei Li: Navigating the Present and Future of AI appeared first on Analytics Vidhya.

Analytics 307
article thumbnail

Product Design & Customer Experience: An Innovative View on Inclusive Product Development

Speaker: Dan Jenkins - Human Factors & Research Lead – DCA Design International

The presentation will be packed full of real-world examples of great inclusive design (covering household products and digital services), alongside a few more detailed case studies explaining how inclusive design can be embedded successfully in the design process. What ‘inclusive design’ really means.

article thumbnail

The Supply Chain & Logistics Journey: Humble Beginnings, Troubled Present, Amazing Future

Speaker: James A. Tompkins, Ph.D.

This presentation provides a brief overview of where supply chains have been and their current status, then dives deep into the incredible role to be played by supply chains going forward. The first 20 years of work on supply chains beget efficiency, the next 10 - efficiency and effectiveness.

article thumbnail

The Essential Guide to Analytic Applications

Embedding dashboards, reports and analytics in your application presents unique opportunities and poses unique challenges. We interviewed 16 experts across business intelligence, UI/UX, security and more to find out what it takes to build an application with analytics at its core.

article thumbnail

Analytics Best Practices: 5 Key Dashboard Design Principles

In this blog, we explore 5 key principles that exist to ensure you create a relevant dashboard that guides and simplifies the user experience, makes it as easy as possible to interpret what is presented no matter its complexity, and increases the adoption of BI.

article thumbnail

All Method, No Madness: Guiding Agile Teams Through Research

Speaker: Amanda Stockwell, President of Stockwell Strategy

Join Amanda Stockwell, President of Stockwell Strategy, as she presents common issues agile teams have with incorporating research, and how to solve them. Using the right strategy, your agile team will collect qualitative data, interpret it, and integrate it effectively. In this webinar, she'll make specific suggestions around: Team makeup.

article thumbnail

Building Evolvable Architectures

Speaker: Dr. Rebecca Parsons, CTO of ThoughtWorks

Join Dr. Rebecca Parsons, CTO at ThoughtWorks, as she presents: How to build evolvable solutions. It’s no surprise many CIOs and CTOs are struggling to adapt, in part because their architecture isn’t equipped to evolve. This webinar will discuss what’s at stake if companies continue to use long term architecture plans.

article thumbnail

How to Democratize Data Across Your Organization Using a Semantic Layer

Speaker: speakers from Verizon, Snowflake, Affinity Federal Credit Union, EverQuote, and AtScale

Each panelist will present and discuss actionable strategies for making data as consumable as possible by everyone in the organization and for increasing data velocity for faster insights using a semantic layer.

article thumbnail

A Practical Guide to Business Intelligence Governance

Speaker: Marius Moscovici, CEO Metric Insights & Mike Smitheman, VP Metric Insights

This presentation will provide a practical step-by-step guide for implementing effective BI governance and a toolkit for addressing the three critical aspects of any program: People - Roles and responsibility in the governance process. To be effective, Business Intelligence (BI) governance must cover both data and visualizations.