Depict Data Studio full courses always end with a graduation ceremony where participants share the progress they’ve made in the course. I’m always amazed by the transformations that take place and I can’t help but want to share their wonderful work!
In this blog post, you’ll learn from Elizabeth Dove. Elizabeth is a professor at the University of Montana who teaches art and design. She also co-directs the Innovation Factory (IF). Thanks for sharing, Elizabeth! –Ann
—–
I teach art and design at the University of Montana, and completed Ann’s Powerful Presentations course during Spring 2021.
I registered for the course because although I have advanced graphic design skills, I still thought I could make more effective presentations by working through the course’s sequential lessons of message, design and delivery.
The course was great, and I’d like to share some of what I learned! So here is one trick, one tip, and one thing to try.
Presentations Trick: Adding Perfect Shapes
Sooner rather than later you’ll need to insert a shape into your slide, and often you’ll want that shape to be a perfect circle or square.
You might have figured out how to enter height and width dimensions to get a perfect square for instance in PowerPoint:
- Insert
- Shape
- Draw a squareish shape
- Shape Format
- Enter 2.00” for height and 2.00” for width to make a perfect 2” square
But a faster way is to:
- Hold down the SHIFT key as you drag out a shape, and it makes it symmetrical in height and width, so you’ll get a perfect circle, square, or triangle, or star every time.
Hold down the shift key whenever you resize as it will keep whatever proportions intact for every shape, just identically scaling it larger or smaller.
I first learned this trick using Adobe software and was pleased it works in the Office suite too, so try it in whatever design software you use frequently if you haven’t already!

Presentations Tip: Monochromatic Tints of Brand Colors
In the Powerful Presentations course, we learned how to set-up brand colors, brand fonts, and save them as a custom theme.
This is a time-saver and adds a sense of visual cohesion to any presentation.
Using PowerPoint, I further figured out an easy approach to making title slides where you can quickly switch between colors to tint a photograph, illustration or graphic to match your branded palette. It’s a snap.

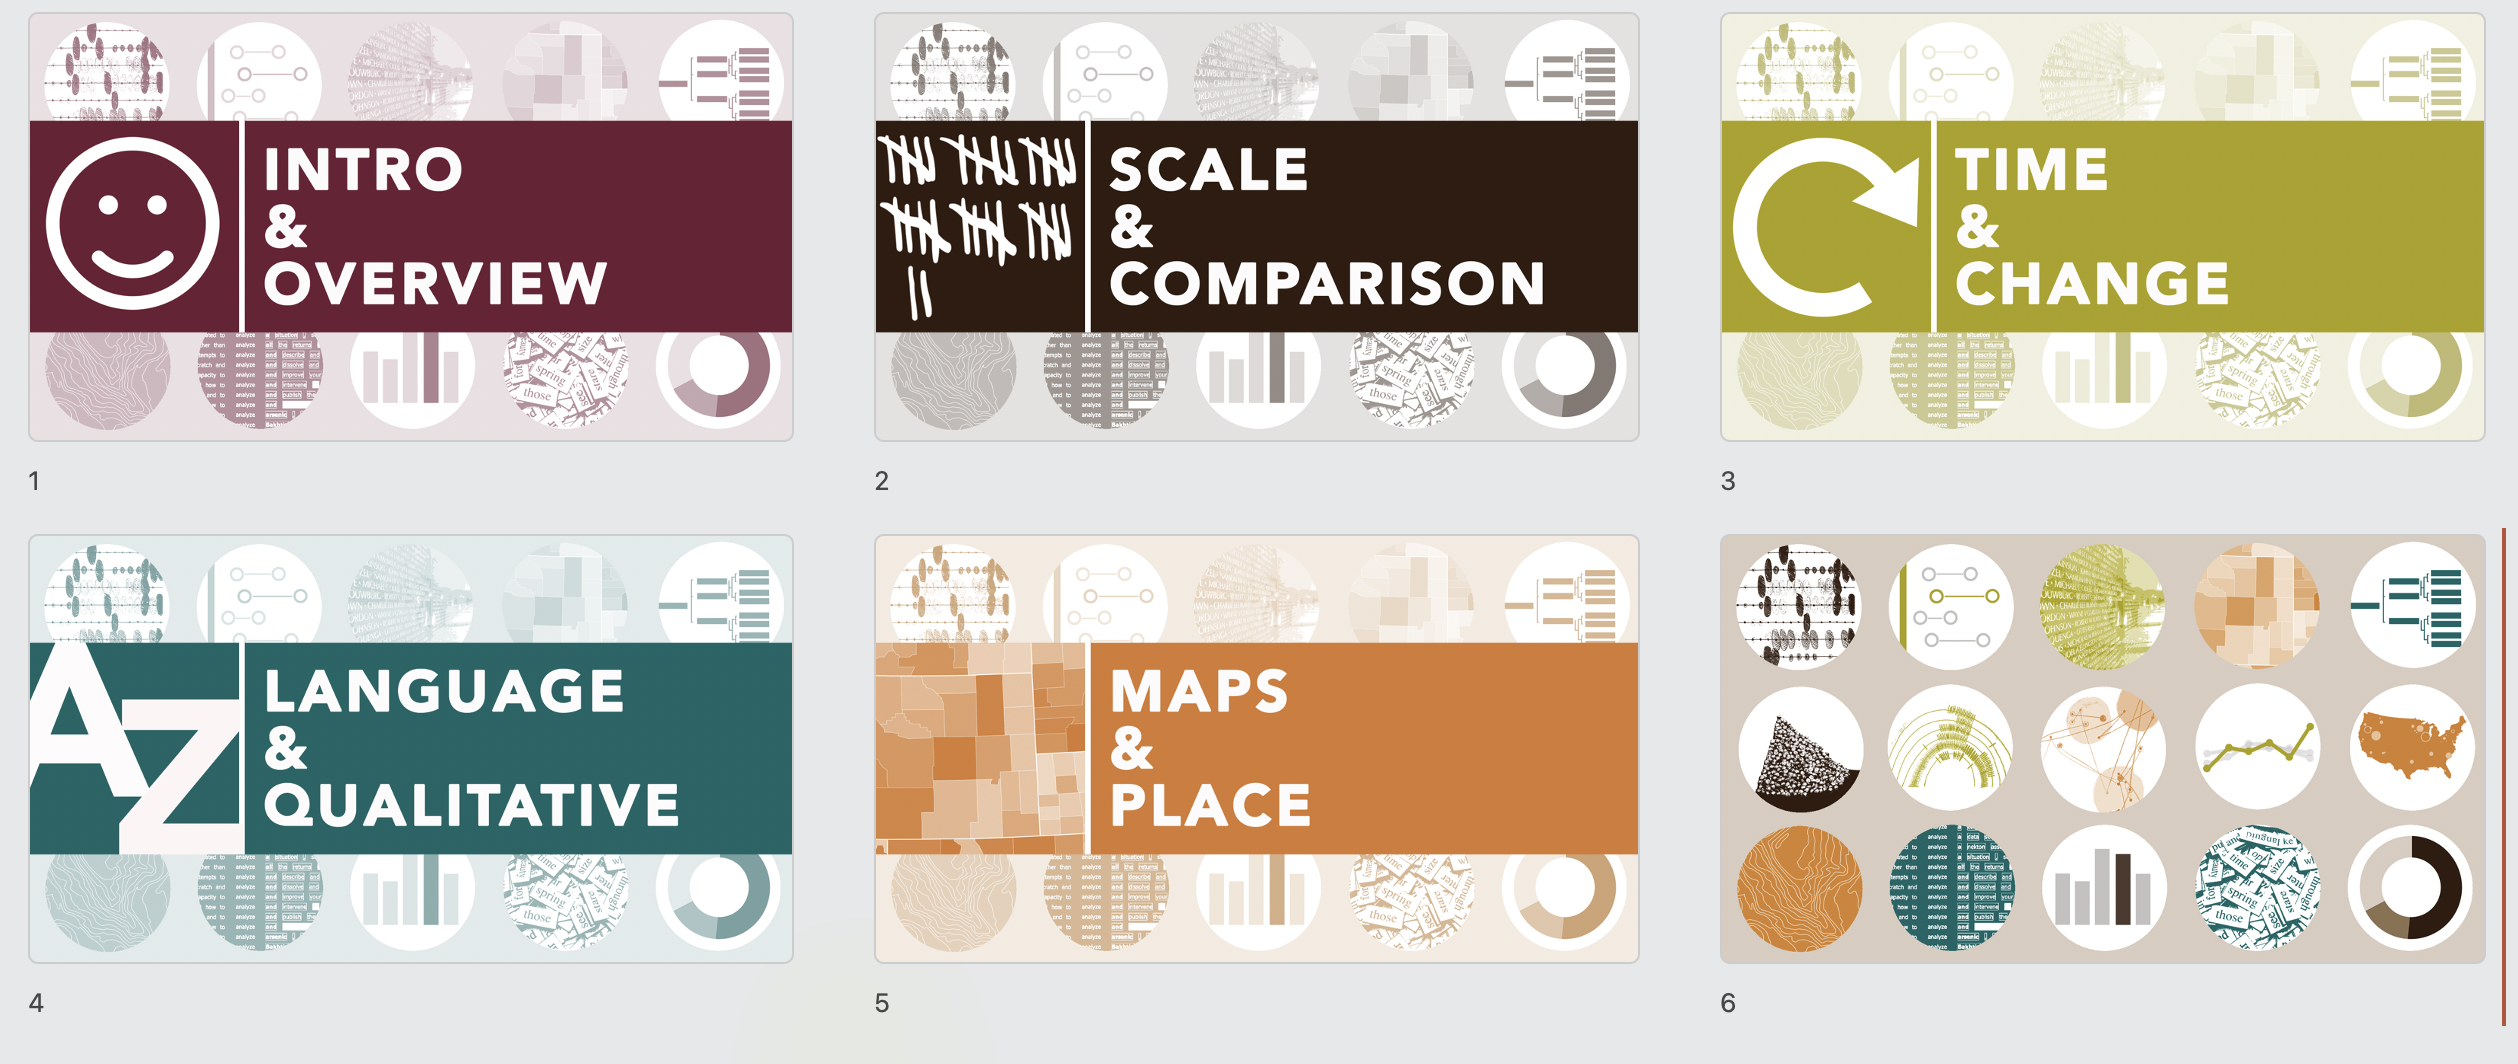
I started with this design, a grid of 12 circles, each with a different image. My design uses four colors from the brand palette of my university, which are I already setup in PowerPoint as custom colors.
I am developing a new course called “Data Arts,” which introduces basic data visualization techniques as well as the work of contemporary data artists. While I like this design for the course’s promotional material, I found it’s a little too busy and colorful to use as a background for my presentation’s title slides.
But check out this easy alternative:

Double Click or Right Click>Format Picture to bring up the Format Picture menu.

Select the Landscape Picture icon>Picture Color>Presets.

Pick from options using your brand colors. I prefer the bottom row of options, which adds a monochromatic tint of color over the image while maintaining contrast and brightness.

With one click, change to try another color.

Save and close your file as normal.
Good news – when you return to work on it days later all these choices remain, including just reverting back to your original. This is referred to as “non-destructive” editing in the digital imaging world, and it is such a great feature for experimentation and creativity, because you risk nothing!
Creating Cohesive Title Slides
I quickly created a title slide for use on all my course presentations with the same image as a background, as I think this communicates cohesion and familiarity to my students.
But each time we switch to a new section of the course, the title slides also switch to a new brand color that corresponds to that section, as follows:

This color tinting technique can be applied to apply to many image types, including screenshots and photographs, giving you a quick win for design cohesion and unity.
For additional control over the intensity of the image, try adjusting Picture Transparency in the same PowerPoint Picture Format menu.

Thing to Try
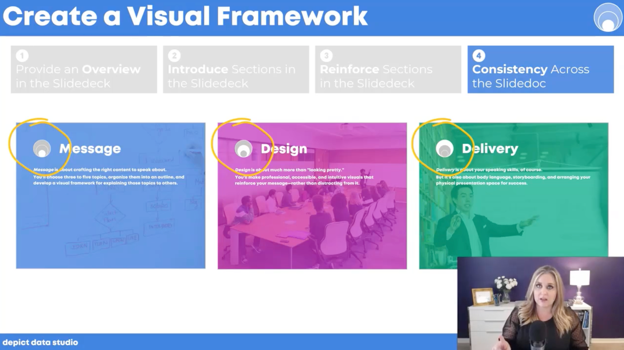
Early in the Powerful Presentations course we had a lesson on Creating a Visual Framework.
In short, the visual framework is a design element – like an icon – that is symbolic of the organizational approach taken within the presentation.
For example, a simple Venn diagram with two parts could be your visual framework, and it would be communicating that two things are being discussed as well as their critical overlapping region.
Using this icon early in your presentation and returning to it throughout the talk or the project helps your audience know where they are in the process, and lets them absorb a lot of information without feeling overwhelmed.
It helps you – the presenter – organize and clarify your thoughts since they fit this visual model.
Simple enough, right?
Well….. kind of.
It’s simple and apparent once you pick your visual framework. But that selection is critical, and I don’t think it’s easy, but I still recommend wrestling with this task.
It is important because it’s making us think visually, so that we can then effectively communicate visually. We have to tap into the most creative part of our brains and pick a visual metaphor.
This metaphor, or framework, is an iconic shape or diagram that will resonate with your audience: maybe a pyramid, a cycle, or a ladder.
Although it is a simple shape it operates symbolically to represent the strategy and approach you are taking with the presentation as a whole. It is making the abstract concrete, its art and its design, and that is tough!
Ann coached us to dive into this territory, while acknowledging its tough. We thought broadly about our topic and what we wanted to communicate and achieve in our presentation. Are we discussing a project that is likely to cycle through sequential steps, looping to renew and begin again? Then maybe something like this circular diagram.
Are you working on a project where disparate entities are operating in tandem, but directly not partnering or collaborating while working towards a shared goal? Then maybe something like these parallel arrows each making progress left to right.

Does your presentation start with a shared premise and set of conditions, but is expected to branch out in unexpected or experimental ways, somewhat unevenly? Then maybe this is network icon could be the visual framework.
Does your project start with a set of broad foundational skills, that act as a layer to support successive steps, which each get more important and also more refined as you go? Then maybe a pyramid is the right visual metaphor.

Hopefully you get the idea!
Simple iconic shapes like interlocking puzzle pieces, nested concentric circles, segmented donut shapes or hive-like hexagonal structures are all possible solutions – but each of these visual metaphors communicates a very different approach, strategy or experience to a viewer.
To get started, check out the free resources and download designs to get preliminary ideas from: https://diagrammer.duarte.com/.
How to Use a Visual Framework
Once you do the hard work to pick your visual framework, how do you use it?
Ann suggested four main opportunities, as follows:
- Providing an Overview in the Slidedeck
- Introducing Sections in the Slidedeck
- Reinforcing Sections in the Slidedeck (helps the audience oriented to where they are in the presentation)
- Consistency Across the Slidedoc (for branding and polish)
I applied my visual framework in each of those four categories, and appreciated the icon’s value in helping me organize and improve the visual cohesion of my presentations.
But I see the significance of designing a visual framework as so much more. The effort to pick the right visual metaphor transformed the way I understood my own content and how I should be teaching it.
By thinking through the symbolism of hierarchies, nested shapes, steps or cycles I found myself inspecting the content of my course in important, deep, and insightful ways.
By asking myself to design a visual analogy – this simple icon/diagram – I had to address the themes and intentions of my projects and my approach to communication early in my process.
Vital work! Try it!
Connect with Elizabeth
LinkedIn: @elizabeth-dove-406
Website: www.elizabethdove.com
Leave a Reply