Technology evolves, the industry changes and the way businesses use technology changes. The road that has brought us to the current state of reporting capabilities in the Microsoft data platform has been long and winding. Ten years ago, we were using SQL Server Reporting Services (SSRS) to create interactive, dashboard-like reports scorecard reports. It wasn’t easy and the report interactivity wasn’t exactly “snappy” as the report server had to re-query data and re-render the report every time a link or chart series was clicked. But, because SSRS was the best tool that we had back in the day, the techniques we used for advanced report development were arcane by today’s standards. Over the years, I’ve written a few articles and posts about how to create reports with interactive KPI gauges, charts and scorecards using SSRS. Today we have a better tool for that style of reporting and analytics. Reporting Services remains a powerful and flexible tool for a few different styles of reports. Now that SSRS has been integrated into the premium Power BI service as “Paginated Reports”, this raises questions about how and when to use each tool – and how to use them together.
Related: Gauges in SSRS reports | Graphical Report Design
Power BI
Power BI makes the chore of creating highly visual and interactive reports much easier and the user experience is far more modern and engaging. However, Power BI reports are purposefully intended to be viewed with each page in a single browser window, with all visuals in view. Power BI reports are not optimized to be printed or split across multiple pages. To a small degree, it is possible to export some data to Excel, PDF or PowerPoint; but this is not the design purpose of Power BI – and it probably never will be. By contrast, SSRS/Paginated Reports was purposefully designed to render reports as continuous, paper-sized pages, with breaks and totals. Paginated reports can be exported to a variety of formats in high fidelity.
Can <> Should
When should we use Power BI vs Paginated Reports for our reporting needs? You can use either tool to create different styles of reports for different purposes, but should you? Just because you CAN doesn’t mean you SHOULD.
- Can we use Power BI to create operational or transactional style reports?
- Can we create scorecards and dashboard-style reports with SSRS/Paginated Reports?
- Should we use a Power BI dataset as a data source for a Paginated report?
The following diagram depicts the relative capabilities and design purpose for these two reporting tools. See the overlap? On the left, you see that Power BI is optimized and best used to create interactive, visual reports, scorecards and dashboard-style reports. Contrast this with Paginated Reports on the right side, which is best used for “list-type” reports that continuously flow across multiple pages. SSRS/Paginated Reports was architected and works ideally with SQL queries, where filter values are passed into the query using parameters.
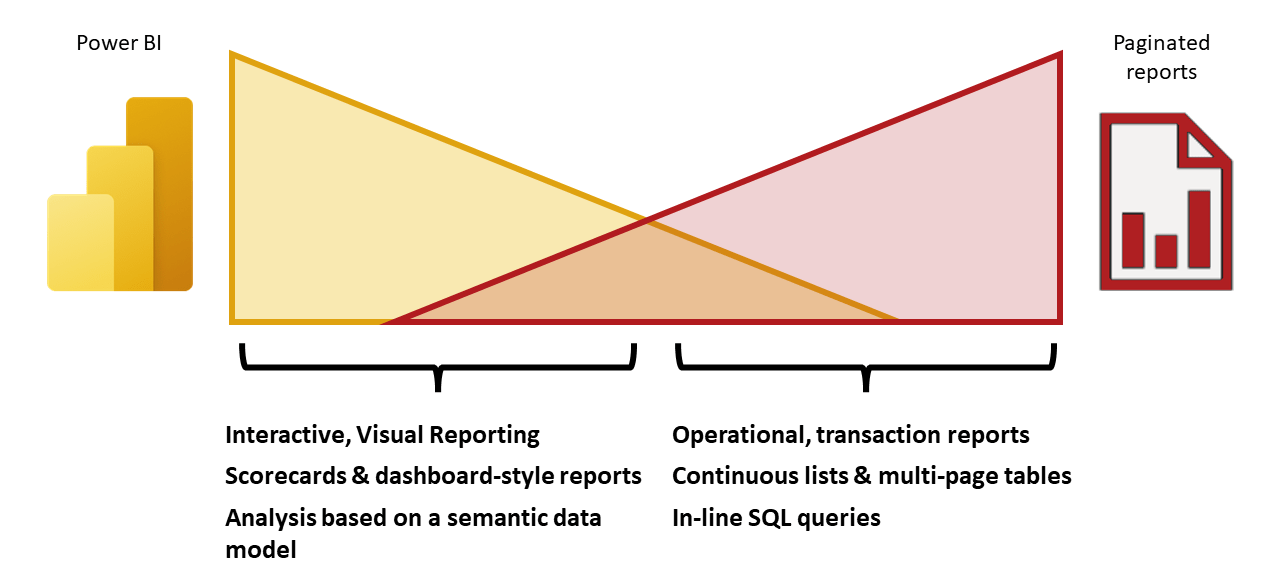
Let’s break-down a few of these important decision points.
Data Model vs SQL Queries
There are a few reporting use cases that would tip the scales in one direction. If the need is to run a query and dump the results into a long list of continuous report pages, that is a classic use case for Paginated Reports. Power BI relies on data organized and optimized in a semantic data model, with data shaped and purposefully structured to support interactivity and analytics. Although Power BI models can handle a lot of data if properly organized, handling transactional details are not a natural fit for Power BI reports, both due to the format and the way data must be modeled for reporting. Importing tables that are both tall and wide, with many columns, will tank Power BI performance and impede users’ ability to explore and interact with analytic data.
By contrast, Paginated Reports rocks at this sort of thing. Need to generate a running list of ten thousand order line items, split into formatted pages with breaks, headers and footers? This is a natural fit for a paginated report. Do you need to export a table-style report to Excel with each page in a separate worksheet? Paginated Reports is a good tool to use for this sort of thing. Under the covers, Power BI communicates with a tabular data model with the DAX query language. Although elegant and efficient, DAX queries can be very verbose and difficult to read. When SSRS was enhanced to work the option to query Power BI datasets, some effort was made to allow the Report Builder query designer to generate DAX query code. It is not robust nor very easy to maintain. If you need to enhance a DAX-query-based report with any degree of sophistication, you will likely not have a good experience. SSRS/Paginated Reports were developed to support, and are best used with, native SQL queries.
There are many nuances to the choice between these two options. A semantic data model provides a layer of abstraction for measures that define calculations and business rules. A model supports self-service analysis and discovery. Row-level security rules ensure that users only see their own protected data. Running a SQL query just gets the job done for a finite set of requirements, and perhaps only for one report.
Interactivity
In a Paginated Report, if you want to give a user the ability to click a chart column or cell in a table or matrix and then navigate or filter items in the report using that value as a parameter; this kind of interaction is possible, but it might take some code and development effort to get there. Even though SSRS and Power BI Paginated Reports are both defined as RDL files, the implementation of Paginated Reports in the Power BI service doesn’t yet support the same native report navigation and drill-though functionality as SSRS on-premises. Report navigation can be achieved using parameterized expressions to build clickable web URL links but this is a work-around solution at best. The product will evolve, and I think we can bet on seeing more and more parity between on-prem SSRS and Power BI Paginated Reports as the product continues to mature.
Guidelines
- Can you create a dashboard-style report with SSRS or Paginated Reports? – Yes, but it is complex and time-consuming.
- Can a Paginated report use a published Power BI dataset or SSAS model as a data source, with filters and parameters? – Yes, but DAX queries generated with the query designer quickly get large, complicated and difficult to maintain. Even using a small number of parameters and fields can produce an unruly query.
- Can the page dimensions of a Power BI report page be resized or to accommodate more visuals than will fit on a standard browser page? – Yes, but several features won’t work as intended, and performance will suffer with more visuals on a single page.
- Can a Power BI report page be formatted to print on a sheet of paper, or exported with formatted and high fidelity to Excel or a PDF file? – Maybe to a point, but perhaps not very effectively.
The bottom line is that both of these tools can be used to create a variety of report styles and to support a range of features, but one is better suited than the other for different purposes. Before stretching the limits of any tool, make sure you are using the right reporting tool for the job and consider how you can use both Power BI interactive reports and Paginated Reports together, to meet your analytic and operational reporting needs.


That is very valuable … here I also find some informative blogs related to what is power bi, which I share with you
https://www.innovationjn.com/what-is-power-bi/
This is a really well written summary, which makes perfect sense. I often think that we get stuck on a particular tool and seem to use it as a “Jack of all trades”, instead of asking the question “is it the right tool for the right job?”. I think PowerBI is fabulous for data visualisations, but there are times when SSRS paginated reports really do the job superbly well. Thanks for sharing.
Hello Paul – I agree with the entire blog content and perspectives but with Inforiver, the technology is here right inside Power BI to offer both operational paginated report that could be visual and interactive as well. I’ve shared our no-code paginated webinar recording for your blog viewers to review Inforiver –