Choose Augmented Analytics With Customizable Reporting for Your Users!
One of the top reasons business users resist adopting analytics is that they perceive these solutions to be too difficult to use and that, even if they can use the solution to perform analytics, the resulting reports and data output are so convoluted and impossible to interpret that they border on useless.
Gartner defines Data and Analytics (D&A) as, ‘…the ways organizations manage data to support all its uses, and analyze data to improve decisions, business processes and outcomes, such as discovering new business risks, challenges and opportunities.’ But how can you discover risks, challenges and opportunities if you can’t understand what the reports are trying to tell you?
‘What if your business could enable report, template and document design and configuration to support preprinted fixed formats too?’
When you consider an analytical solution, choose an augmented analytics package that is designed to serve business users – one that easily enables data integration and produces reports that are meaningful to your team; one that allows your organization and users to create reports for specific departmental needs and to satisfy the role of a user, so these users can share data and output and make confident decisions.
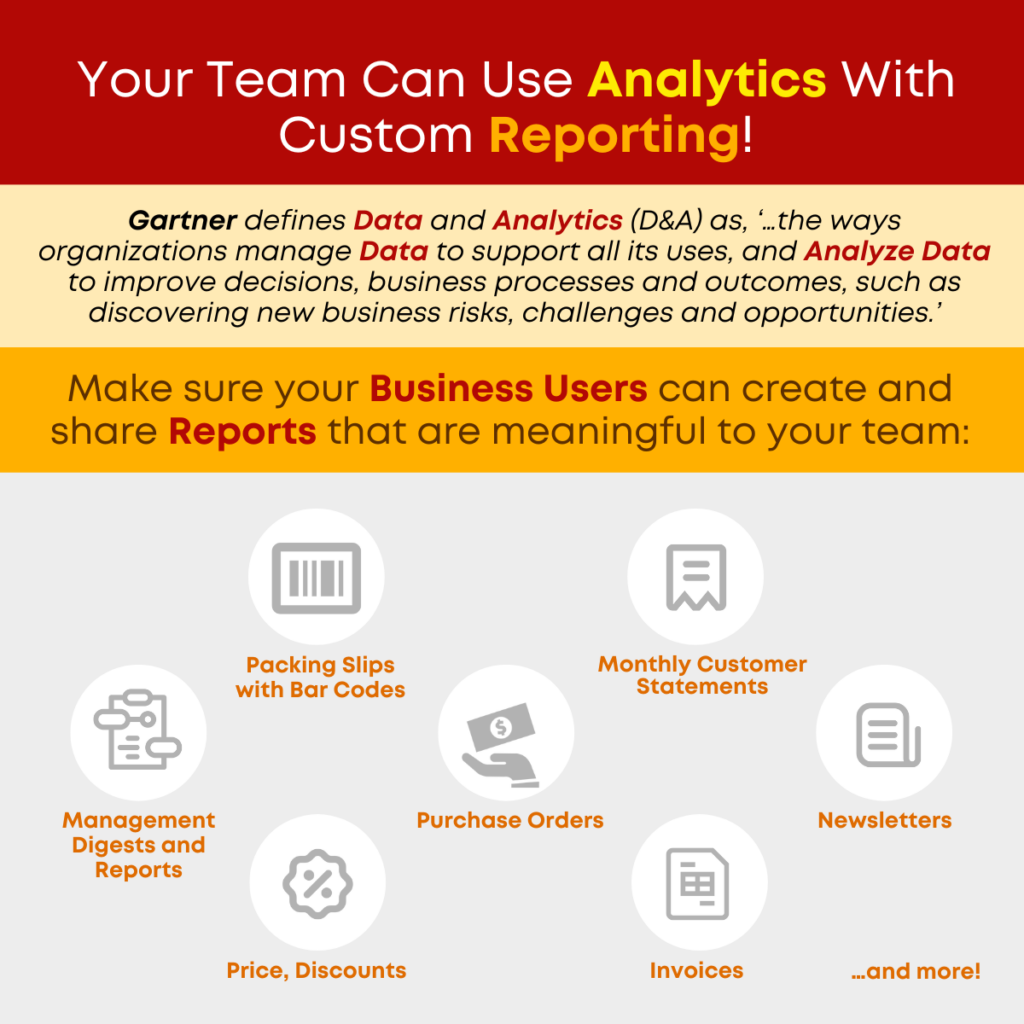
Support your business needs and allow your team to satisfy requirements for all manner of reports, documents, forms and templates including:
- Packing Slips with Bar Codes
- Monthly Customer Statements
- Management Digests and Reports
- Purchase Orders
- Newsletters
- Price, Discount
- Invoices
- Account Ledgers
- Annual Reports
- Statutory Compliance Reports & Statements
What if your business could enable report, template and document design and configuration to support preprinted fixed formats too? IT team members or consultants could leverage a simple, basic programming or scripting environment to define format templates and use data from Smarten Datasets and Smarten objects to produce stunning pixel perfect reports. Users can preview reports, export data to PDF files and share documents and reports via email at predefined frequency using delivery and publishing agents.
Here are some of the many benefits of this reporting environment:
- Customize and Format Reports, Documents, Forms and Templates Using Basic Scripting Skills
- Generate Reports from BI Datasets in Predefined Formats
- Satisfy Unique Business, Departmental, Functional and Statutory Requirements
- Present Information in a Clean, Attractive Format for Customers, Partners, Suppliers, Team Members
- Allows Business Users to Gather, Present and Share Information via Email and Publishing Agent
‘When you consider an analytical solution, choose an augmented analytics package that is designed to serve business users – one that easily enables data integration and produces reports that are meaningful to your team.’
Find out how Smarten Pixel Perfect Print Reports can simplify your workflow and speed the decision process. Watch a video to explore the details and benefits of Smarten Pixel Perfect Print Reports Here, and find out how Augmented Analytics products can help your business plan and forecast for success.
 Advanced Analytics Benefits, Augmented Analytics Company Ahmedabad, BI Tools, Business Intelligence Reports, Modern Analytics and BI, Report Software, Report Tools, Smarten Analytics
Other posts