
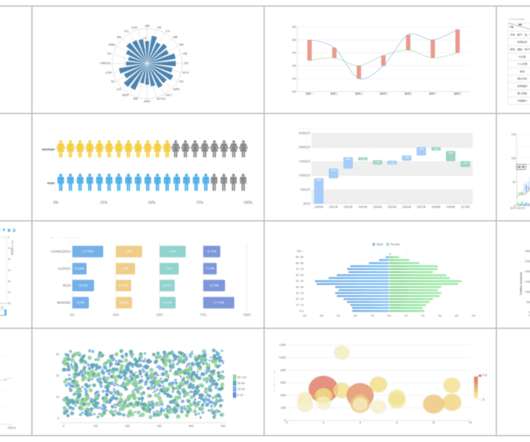
The Ultimate Guide to Power BI Visualizations
Analytics Vidhya
DECEMBER 8, 2023
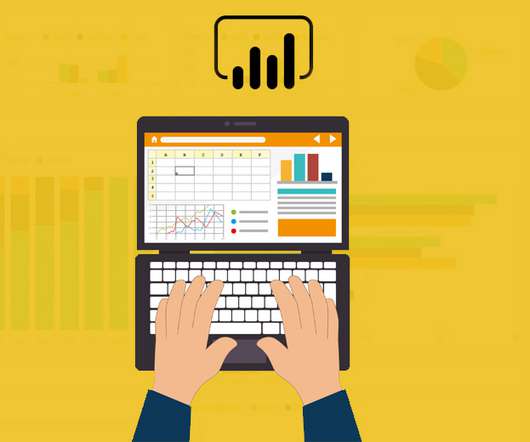
Developed by Microsoft, Power BI Visualizations empower users to visually represent their data and disseminate insights seamlessly across organizational echelons.

Analytics Vidhya
DECEMBER 8, 2023
Developed by Microsoft, Power BI Visualizations empower users to visually represent their data and disseminate insights seamlessly across organizational echelons.

Analytics Vidhya
SEPTEMBER 22, 2021
This article was published as a part of the Data Science Blogathon Image 1 Introduction I am sure many of you have read several articles around the world stating the buzz around “Machine Learning, “Data Scientist”, “Data Visualization” and so on. A report […].
This site is protected by reCAPTCHA and the Google Privacy Policy and Terms of Service apply.
Analytics Vidhya
JANUARY 25, 2023
In line with the latest World Happiness Report, it is evident that being happy has become a worldwide priority. The World Happiness Report rates happiness on six indicators: positive emotions, […] The post Analysing World Happiness Report (2020-2022) appeared first on Analytics Vidhya.

datapine
JUNE 7, 2022
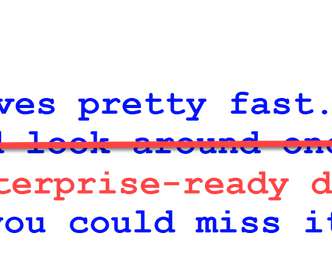
1) Misleading Data Visualization Examples. 2) How to Avoid Misleading Visuals. 3) The Impact Of Bad Data Visualizations. But while that may be the case, people are duped by data visualizations every day. Bad data visualizations come in many forms, with some more obvious than others. Table of Contents.

Advertisement
Think your customers will pay more for data visualizations in your application? But today, dashboards and visualizations have become table stakes. Five years ago they may have. Discover which features will differentiate your application and maximize the ROI of your embedded analytics. Brought to you by Logi Analytics.

datapine
OCTOBER 17, 2019
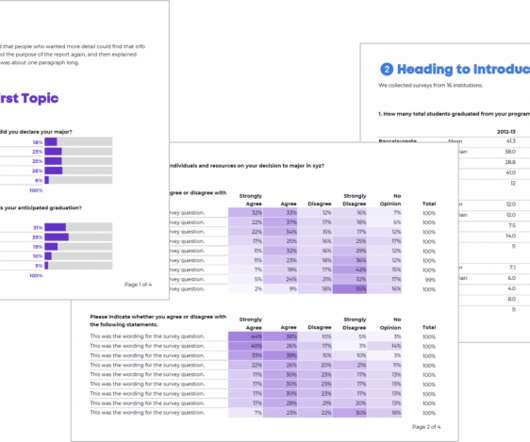
Management reporting is a source of business intelligence that helps business leaders make more accurate, data-driven decisions. But, these reports are only as useful as the work that goes into preparing and presenting them. By the end of this article, making stunning and useful managerial reports will be second nature to you.

datapine
JUNE 15, 2023
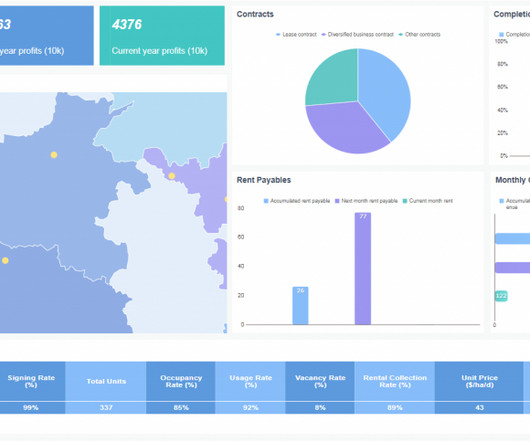
Table of Contents 1) What Is A Performance Report? 2) The Importance of Performance Reports 3) Performance Report Examples 4) Performance Reporting Tips Performance reporting has been a traditional business practice for decades now. At the time, this was not an issue, as the static nature of reporting was the norm.

Speaker: Dean Yao, Sr. Director of Product Marketing, Logi Analytics
Operational reports help get information to the people who need it most, in formats they understand, and in a timeframe that matters. Join the webinar to learn how embedding operational reports can give your users a precisely formatted, ready-to-analyze view of their operational activities.

Expert insights. Personalized for you.


Let's personalize your content