


How Model Observability Provides a 360° View of Models in Production
How do you track the integrity of a machine learning model in production? Model Observability can help. By tracking service, drift, prediction data, training data, and custom metrics, you can keep your models and predictions relevant in a fast-changing world.
Tracking integrity is important: more than 84% of data scientists do not trust the model once it is in production. Most data scientists lack visibility into the deployment behavior and performance of models that are in production.
New DataRobot AI Platform Model Observability features help ensure that you know when something goes wrong and understand why it went wrong.
Manage Unpredictability in Active Deployments
Adoption of AI/ML is maturing from experimentation to deployment. As more and more models make it to production, organizations are now facing a new problem: how are the models in production really doing?
The majority of AI-enabled organizations are still struggling to stay atop the ever-expanding repository of production models. This poses a critical challenge as these models continuously influence key business decisions, such as loans provisioning in financial services, inventory forecasting in retail, or staffing optimization in healthcare.
A myriad of issues can interfere with the performance and delivery of production models, resulting in poor or incomplete predictions and ill-informed decision-making. This is due to lack of holistic visibility into the model operations (or MLOps) system. It’s not enough to simply expose an error; it’s essential to instantly pinpoint the context of the error, thereby enabling quicker resolution.
Model Observability Is More than Just Monitoring
Model Observability provides an end-to-end picture of the internal states of a system, such as the system’s inputs, outputs, and environment, including data drift, prediction performance, service health, and more relevant metrics.
In the AI/ML world, this means you have the ability to not only monitor but also analyze and pinpoint the source of a problem. Model Observability compounds performance stats and metrics across the entire model lifecycle to provide context to problems that can threaten the integrity of your models. Holistic control over ML models is key to sustaining a high-yield AI environment.
One of the most in-demand DataRobot solutions is DataRobot MLOps, providing world-class governance and scalability for model deployment. Models across the organization, regardless of where they were built, can be supervised and managed under one single platform. Aside from DataRobot models, open source models deployed outside of DataRobot MLOps can also be managed and monitored by DataRobot.
It is not enough to just monitor performance and log errors. You also need visibility into prediction requests and the ability to slice and dice prediction data over time to have a complete understanding of the internal state of your AI/ML system. Not knowing the context of a performance issue delays the resolution, as the user will have to diagnose via trial and error, which is problematic for business critical models.
This is a key difference between model monitoring and model observability: model monitoring exposes what the problem is; model observability helps understand why the problem occurred. Both must go hand in hand.
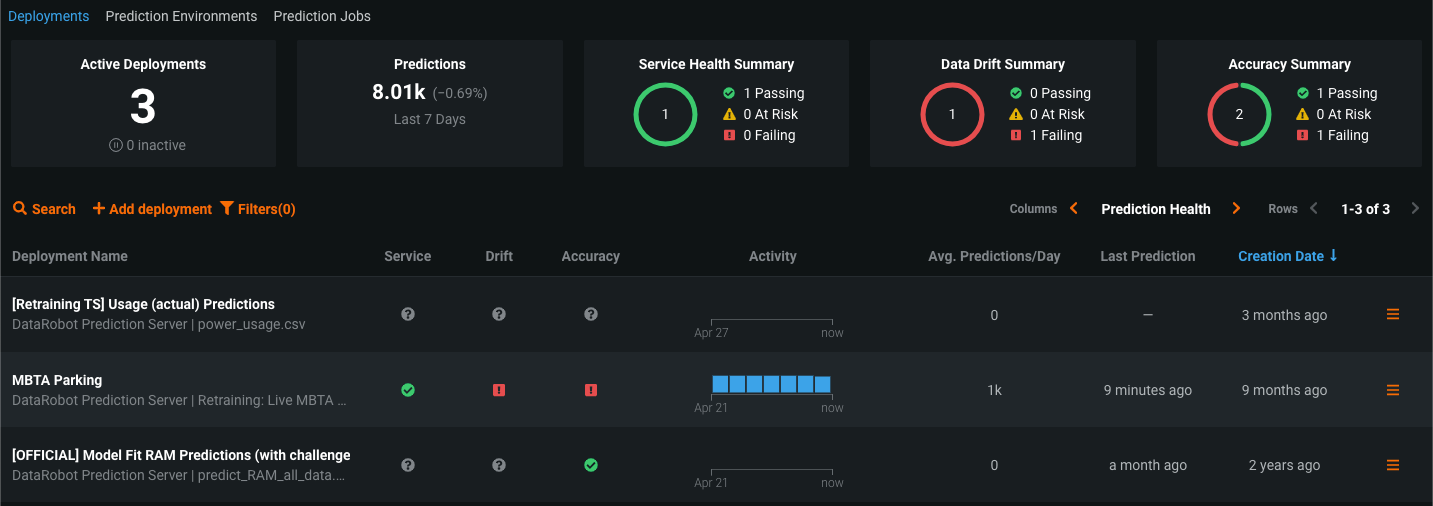
With new Model Observability enhancements, DataRobot MLOps users gain full visibility and the ability to track information regarding service, drift, prediction and training data, as well as custom metrics that are relevant to your business. DataRobot customers now have enhanced visibility into hundreds of models across the organization.
Visualize Data Drift Over Time to Maintain Model Integrity
Data drift is a key performance metric that data scientists should track in order to maintain the high quality results they expect from a model. Data drift occurs when input data changes over time and becomes significantly different from the data that was used during training and validation stages of model development. When this type of drift occurs, your model is at risk of degradation, meaning you cannot trust the predictions anymore.
In addition to being alerted when data drift has occurred, you need to understand how the drift score has changed in order to get a deeper understanding of the cause and impact of this drift.
Data drift can occur for a variety of reasons, including seasonality, change in prediction values, or even different volumes of predictions. The corrective action you take will depend on the cause and context of the drift. Therefore, you need to fully understand why and how drift occurred, which is the ultimate goal of Observability.
DataRobot MLOps offers user-friendly visuals to track data drift over time.
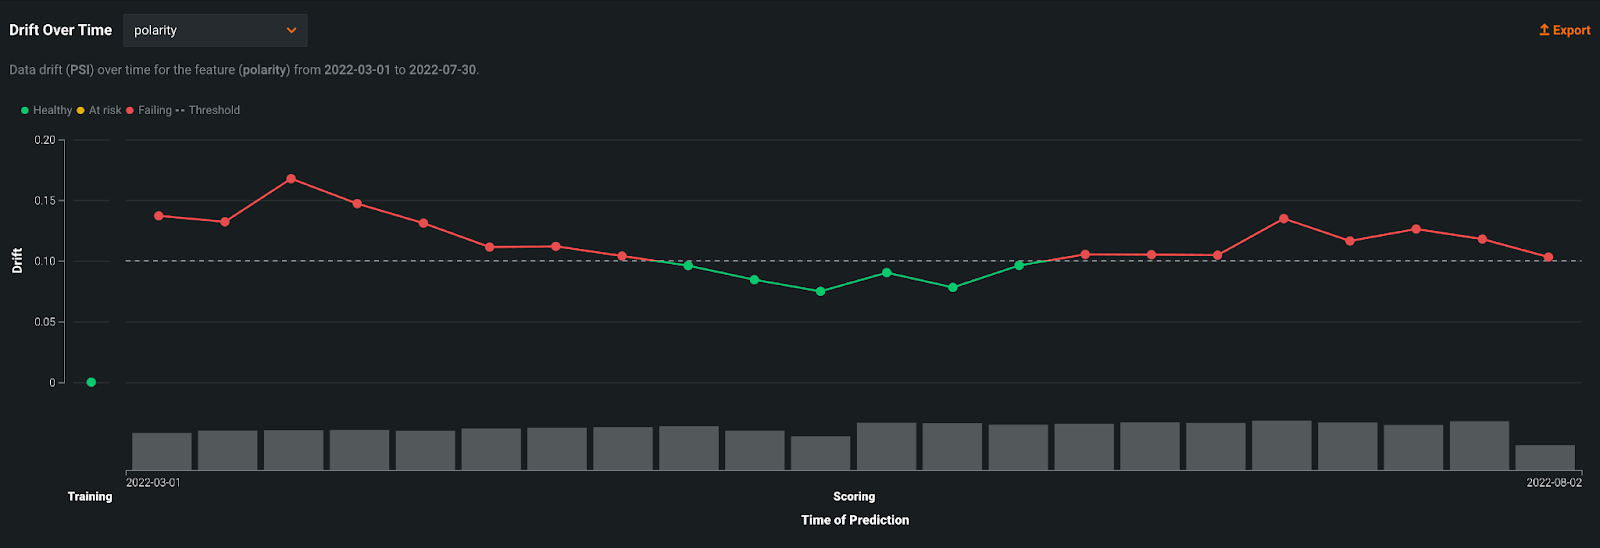
The example above shows drift (y axis) over time of prediction (x-axis) allowing you to easily track trends. The gray dotted line is the acceptable threshold for drift. You can easily scan which predictions surpass this threshold and at what time. Additionally, the gray bars at the bottom of the chart showcase the volume of predictions so that you can understand how many predictions were impacted by drift. Users can slice and dice drift information by choosing different features to investigate drift.
With the interactive ability to compound this information, you can understand why drift is happening and quickly take appropriate action before it impacts the business.
Process Efficiency with Large Scale Monitoring
For true Model Observability, it is necessary to compile different types of stats on predictions, features (raw and final), and target. These stats report a complete view of models in production and must be automatically monitored to keep an eye on performance. As your production model repository grows, the number of aggregations that need to be made also increases.
To speed up this process, these calculations can be done on your edge infrastructure and summarized stats sent back to DataRobot MLOps to monitor data drift. This way, you can monitor multiple production models on a large scale without spending time on manual and tedious aggregations. If you are a Python user, you’ll be delighted to know that this large scale monitoring can be done using a Python library.
Monitor Prediction Process to Optimize Workloads
In addition to tracking data drift over time to maintain high quality models, another important metric to track is prediction processing. Making new predictions using a model sometimes takes longer than expected, and it is necessary to understand the reason for the delay. Perhaps there is a processing delay, or perhaps too many users are submitting requests at the same time and there is rate limiting to distribute compute resources fairly.
Knowing the status of new predictions helps manage workloads appropriately. More important, this knowledge informs you when predictions are complete so that you can then request other critical metrics like data drift and accuracy. If you view data drift information before all your predictions are processed, it could be misleading or incomplete, as this drift score would only include a subset of your predictions.
With DataRobot MLOps, you can self-service deployment information without bothering developers or IT, or worse, playing the guessing game. (*Prediction processing stats will be accessible in October.)
Let’s use the example above to see how you would help yourself to critical information regarding the progress of your predictions. The stacked histogram shows counts of predictions (y-axis) for your champion model and is broken into colors representing predictions that are processed already (green), rate limited (red), and skipped (white). At a quick glance, you can be informed about what’s done and what’s left. The gray dotted line shows you the hourly rate limit (hence the bars going past it are red as they have been rate limited for now).
On the right, you will notice information regarding the processing delay your request is experiencing.
As the user, you are informed about deployment activities and can make appropriate decisions on how to spend your time and your workloads. This transparency is critical for Model Observability and helps you quickly see when something goes wrong and understand why it went wrong.
Learn More About DataRobot MLOps
DataRobot offers the best-in-class model development and deployment experience helping organizations achieve success via applied AI. DataRobot is a continuously improving platform designed to match real-world business needs.
Learn more about DataRobot MLOps and access public documentation to get more technical details about recently released features.

May Masoud is a data scientist, AI advocate, and thought leader trained in classical Statistics and modern Machine Learning. At DataRobot she designs market strategy for the DataRobot AI Platform, helping global organizations derive measurable return on AI investments while maintaining enterprise governance and ethics.
May developed her technical foundation through degrees in Statistics and Economics, followed by a Master of Business Analytics from the Schulich School of Business. This cocktail of technical and business expertise has shaped May as an AI practitioner and a thought leader. May delivers Ethical AI and Democratizing AI keynotes and workshops for business and academic communities.
-
How to Choose the Right LLM for Your Use Case
April 18, 2024· 7 min read -
Belong @ DataRobot: Celebrating 2024 Women’s History Month with DataRobot AI Legends
March 28, 2024· 6 min read -
Choosing the Right Vector Embedding Model for Your Generative AI Use Case
March 7, 2024· 8 min read
Latest posts
