Also known as Stepped Bar Chart, Step-by-Step Bar Chart, or Staggered Bar Chart.
A Progressive Bar Chart is a visualisation method that builds upon the concept of a 100% Stacked Bar Graph. In essence, it retains the idea of displaying parts relative to a whole but introduces a key modification: the individual segments within the bars are staggered from one another. This displacement serves to enhance the visibility and focus on each segment, making it easier for viewers to discern and interpret the data.
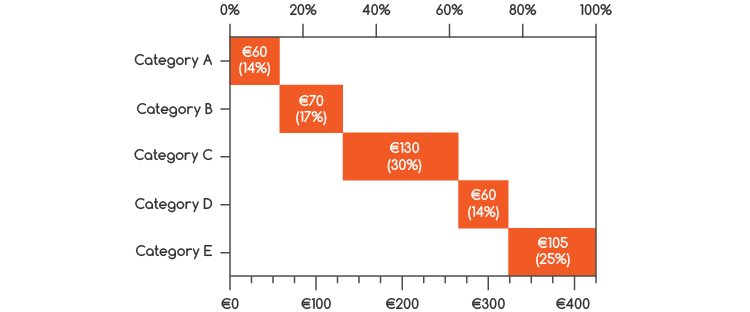
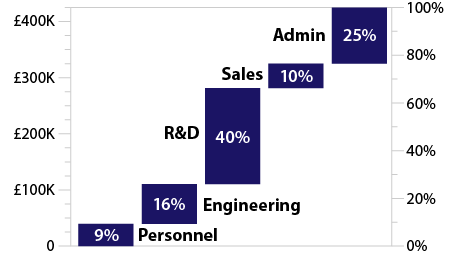
In a Progressive Bar Chart, the displacement of segments can vary in direction (up or down when horizontal), typically exceeding the width of the bar itself. This consistent displacement throughout the chart ensures that each segment stands out while still conveying their cumulative contribution to the overall whole.
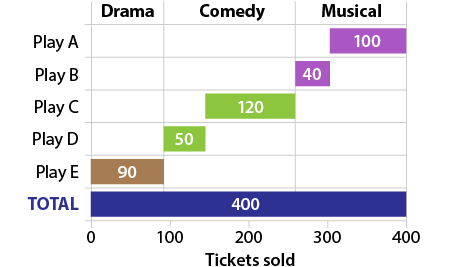
Progressive Bar Charts sometimes include an additional bar representing the total of all individual segments, providing viewers with a clear reference point for the overall value.
Examples
Related posts:
Further Exploration #11: Bar/Column Chart Variations

