article thumbnail

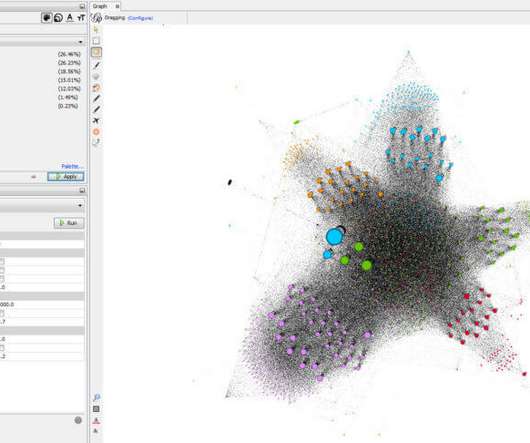
Predicting Employee Attrition using Orange(.ows) Visual Programming Software

Analytics Vidhya

ows) Visual Programming Software appeared first on Analytics Vidhya. This article was published as a part of the Data Science Blogathon. Introduction If you want to know – How to use MACHINE LEARNING. The post Predicting Employee Attrition using Orange(.ows)

article thumbnail

Remove Your Rose Tinted Glasses: Data Visualizations Designed to Mislead

datapine

1) Misleading Data Visualization Examples. 2) How to Avoid Misleading Visuals. 3) The Impact Of Bad Data Visualizations. But while that may be the case, people are duped by data visualizations every day. Bad data visualizations come in many forms, with some more obvious than others. Table of Contents.

Insiders

Sign Up for our Newsletter

This site is protected by reCAPTCHA and the Google Privacy Policy and Terms of Service apply.

article thumbnail

Data Visualization Boosts Business Scalability with Sales Mapping

Smart Data Collective

Data visualization tools have become very useful for many businesses. Companies use data visualization for trend mapping, data contextualization and various forms of business optimization. billion on data visualization technology within the next three years. billion on data visualization technology within the next three years.

Sales 115
article thumbnail

Best BI Tools Examples for 2024: Business Intelligence Software

FineReport

Evolving BI Tools in 2024 Significance of Business Intelligence In 2024, the role of business intelligence software tools is more crucial than ever, with businesses increasingly relying on data analysis for informed decision-making.

article thumbnail

Monetizing Analytics Features: Why Data Visualizations Will Never Be Enough

Think your customers will pay more for data visualizations in your application? But today, dashboards and visualizations have become table stakes. Five years ago they may have. Discover which features will differentiate your application and maximize the ROI of your embedded analytics. Brought to you by Logi Analytics.

article thumbnail

Create Modern SQL Dashboards With Professional Tools & Software

datapine

In some cases, you will need a coding solution where you can build your own queries, but in others, you will also look for a visual representation of your realational data. Your Chance: Want to test a SQL dashboard software completely for free? How To Create SQL Dashboards – Coding & Visuals. What Is A SQL Dashboard?

article thumbnail

Exploring Data Wonders: Data Visualization Examples & Considerations

FineReport

As the realm of data visualization undergoes rapid proliferation, diversifying applications, and evolving presentation formats, its expansive landscape unfolds. Mirroring the growth seen in other emerging concepts, the boundaries of data visualization remain in a state of continual expansion and is vital when you generate reports.

article thumbnail

Embedding Operational Reports: Everything Product Managers Should Know

Speaker: Dean Yao, Sr. Director of Product Marketing, Logi Analytics

World-class software teams are embedding operational reports to empower end users with interactive data visualizations, detailed information, and highly precise formats that can be shared via email, PDF, print, or online. You’ll learn: Best practices for embedding operational reports in your application.