30 Resources for Mastering Data Visualization
Want to master data visualization? This list of 30 resources and tools will help you get started on your path toward mastering data visualization.
We've all been there. There’s a really cool pattern in some data you've seen and you are thrilled to share it. For example, maybe you've noticed that when you run during cold weather, you run one minute faster per mile than when you run during warm weather.
You want to share these exciting findings with someone who matters to you. Maybe it's your boss. Maybe, in the running case, it's your partner or your running group.
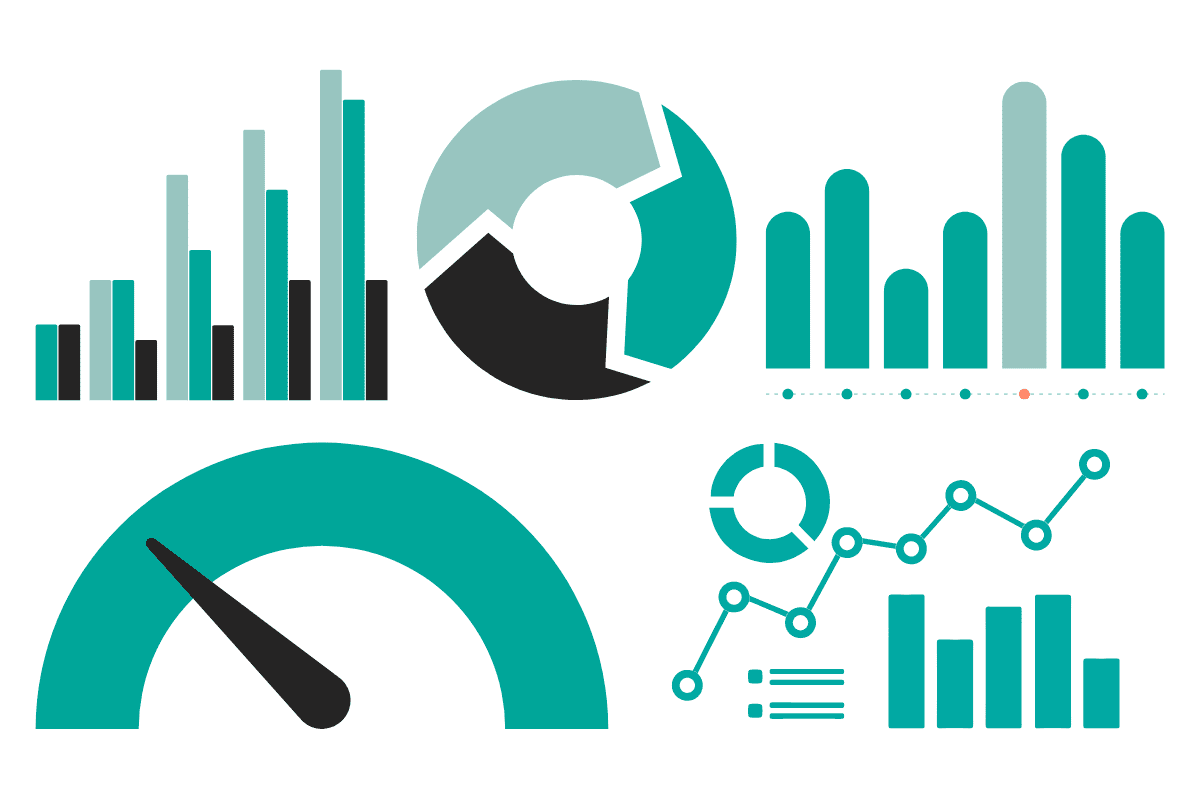
You show them your awesome table with your super fun numbers – and they stare at you blankly. In your excitement to show your findings, you’ve forgotten a fundamental truth about human nature: Nobody likes to look at tables. But everyone loves to look at a beautiful, informative graph. This is why data visualization matters.
Research shows we process images 60,000 times faster than we process words. You can test this for yourself – look at a table filled with numbers, and then try looking at a chart that represents the same thing. Which one gives you more information faster? Which one do you enjoy looking at more?
Data visualization is an art and a science. It’s a science because, of course, the data part comes from numbers and facts. But it's an art because you have to think about the psychology of your recipient. You have to think about the format of your numbers. You have to think about what you're trying to communicate and how. And you have to know how to make it pretty. That’s the viz part.
In my opinion, every person would be better off if they knew how to effectively use data visualizations (and Paul Petrone of LinkedIn Business agrees with me). Almost all of us, at some point or another in our lives, will be tasked with sharing some numbers. Increasingly, to be in business means to be in data. There’s no end to that.
Want to master data visualization? This list of 30 resources and tools will help you get started on your path toward mastering data visualization.
What do you need to Master Data Visualization?
There are just three things you need to learn data viz.
One is data. Pretty self-explanatory.
The second is some kind of interface, to do the viz – it can be a language, like Python or R. It can be a tool like Google Sheets.
And third, you need the desire to share some knowledge. If you try to learn data viz just to tick it off some list, you’ll struggle. But if you have a burning wish to make some awesome graphs to show off a cool finding, it’ll be much easier.
Examples include:
- For your job or degree
- A passion project, like my running example from earlier
- A problem you’re facing, like how to cook cheaper meals
With those three ingredients, you can master data visualization.
Where to get Data?
If you don’t have your own data from work, school, or your own life, you will need sources of open-source data to use. Here are a few free options:
- Tidy Tuesdays. This GitHub is updated on a weekly basis with free, fun data anyone can use. It’s geared to help newbies learn to use R and the `tidyverse` packages, but anyone can use the data.
- The Pudding. It’s a very fun website for anyone to explore data viz. They write articles using data from music, history, politics, social justice, and crosswords (and a ton of other topics. Have a browse – you’ll find something.)
- Kaggle. Kaggle is a community of data scientists with a lot of competitions and contests. When you enter a contest, you get to download the data for that contest.
- FiveThirtyEight. This is a news and sports site with a lot of very fun data reporting.
- NASA. Probably doesn't need an introduction. If you like space or earth science, you’ll find some awesome datasets here.
Free Resources to Learn Data Visualization

The internet is overflowing with free knowledge. It’s in blog posts, YouTube videos, free courses, and even in short-form TikToks. The hard part is navigating it to find the content that’s really worthwhile.
Here are the very best of them. I’ve grouped them by interface since that’s the defining way to learn data visualization in my opinion.
Data Visualization in Python
Python is awesome for data viz thanks to its user-friendly libraries like matplotlinb and Plotly. Python itself is also open-source and free. To master data science using Python, here are some free resources I recommend:
- The Data Visualization with Python Coursera course. Coursera courses are auditable, so you can learn the skills for free – you just won’t get the certificate.
- EdX runs a similar course for free, though your access to course materials expires about a month after you start. Learn quick!
- The SimpliLearn YouTube channel is absolutely chock full of free and awesome resources. Here’s just one example of their Python Data Visualization tutorial.
- This Towards Data Science article runs you through a bunch of the Python libraries you’ll need to get started.
- Chapter Nine of the (free) book Python for Data Analysis is a gem and is available here. (If you’re interested in Python, the full book is well worth reading in its entirety.)
Data Visualization in R
Like Python, R is open source, free to use, and maintained by a community of eager and generous coders. Its `ggplot2` package and `tidyverse` make it a dream to visualize data with. Here are the free resources you need to get started:
- Here’s the auditable Coursera course on R data visualization.
- And the EdX equivalent here.
- Simplilearn has an R data visualization video and playlist.
- I loved this article on “Data Visualization Using R for Researchers Who Do Not Use R.” As the title suggests, it’s geared for people who want to make nice graphs but haven’t used R before. I found it a comprehensive and even fun tutorial.
- Here’s the bible/textbook about R for Data Science. Chapters 3 and 38 are the key ones, but the whole book is engaging and informative.
Data Visualization in Google Sheets
Google Sheets isn’t open source. However, I’m still including it because it’s much more accessible for anyone who isn’t familiar with R and Python (or any other programming language). Plus, because the product is owned by a very rich company that wants you to adopt their products, there’s a wealth of free information available designed to get you hooked on Google Sheets.
Here are the free resources to master data viz with Google Sheets:
- Start here, with their intro blog post on the subject. It gives you a great scope of what’s possible.
- Next, check out their tutorial here, which walks you through creating a few visualizations about the highest-grossing films.
- Here’s a great (and short) YouTube video by Pailsware Product Academy on visualizing your budget using Google Sheets.
- This free textbook helps you fully master Google Sheets data viz in all its nuances. It’s comprehensive and thorough.
- Coursera and EdX also offer free auditable courses.
Sources of Inspiration about Data Viz
Going back to my original point about how to master data visualization, one of the key ingredients is passion. You have to really care about what you’re doing. Data viz has to be exciting in order to master it.
That fuel can be internal, but if you’re lacking inspiration, there are tons of places to get external motivation, too.
Data Viz Influencers
Here are some awesome data visualization influencers I recommend following. These data visualization experts will:
- Demonstrate best-in-class techniques and styles
- Keep you up to date with new tools or languages
- Offer additional sources of data
- Share their contagious excitement and passion for data viz
Here’s who I recommend following:
- Nadieh Bremer. She’s a data visualization artist + graduated astronomer. Here’s one of her data visualizations I loved, about when babies are born.
- Cole Knaflic. She’s the CEO and author of Storytelling With You, and her website storytellingwithdata.com has a fabulous community section with challenges and data visualizations.
- David McCandless is a writer, designer and author who runs the @infobeautiful Twitter account. One of my favorite data visualizations documents the lamest Wikipedia edit wars.
- Browsing the #dataviz or #datavisualization hashtags regularly will give you the chance to create your own curated list of data viz influencers.
There are tons of people online having fun and creating spectacular data visualizations online. Pick the ones you like and go from there.
Data Viz Communities
Inspiration doesn’t have to only come from the top. Another great way to get motivated and excited about data visualization is by joining communities. Here are some great ones to get involved with:
- TidyTuesday. I know I already shared this one, but I’m sharing it again! It’s a great source of regular challenges, awesome people, and free resources to master data visualization.
- Kaggle. Another repeat, but it’s worth keeping in mind. The competition aspect is a good way to get invested in mastering data viz.
- The Data Visualization Society has a free membership tier (and a few paid ones). The free tier gives you access to a Slack channel where you can chat with other like-minded data viz enthusiasts.
- Python has a Discord server where they frequently chat about data science and data viz.
How to Master Data Visualization
Data visualization is a good skill for anyone to practice, no matter what your job or situation is. It’s always useful to know how to effectively present data, whether you’re a data scientist or a barista. Plus, it’s surprisingly fun and satisfying to know how to share information with others in a way that makes them pay attention.
If you want to know what other skills you need to have as a data scientist, go ahead and check our post “Data Scientist Skills”.
Like any other skill, mastering data visualization comes down to interest and practice. If you have data, an interface tool, and the will to keep at it, you’ll be on your way in no time. This list of 30 resources should help you on your journey toward mastering data visualization – and have fun while you do it.
Nate Rosidi is a data scientist and in product strategy. He's also an adjunct professor teaching analytics, and is the founder of StrataScratch, a platform helping data scientists prepare for their interviews with real interview questions from top companies. Connect with him on Twitter: StrataScratch or LinkedIn.