
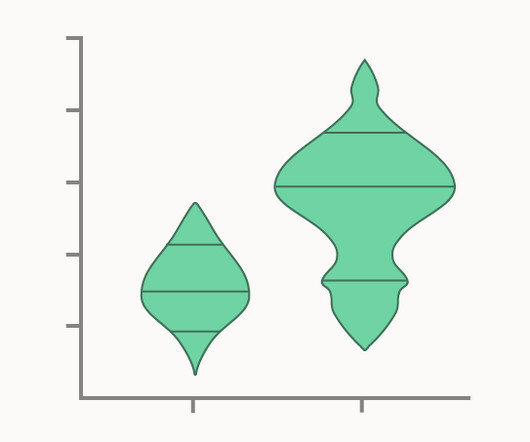
Chart Snapshot: Box-Percentile Plots
The Data Visualisation Catalogue
MAY 6, 2024
Banfield in their 2003 paper The Box-Percentile Plot. Combined impacts of ENSO and MJO on the 2015 growing season drought on the Canadian Prairies Related Posts: Further Exploration #4 Box Plot Variations The post Chart Snapshot: Box-Percentile Plots appeared first on The Data Visualisation Catalogue Blog. Esty and Jeffrey D.


Let's personalize your content