Remove 2005 Remove Data Collection Remove Optimization Remove Visualization
article thumbnail

Experimenting to Win with Data

Sisense

The key to coming up with the best insights lies in delving deeply into both questions; the answers you discover can help you get even more out of your data. The experiences of Measuremen, an international consultancy that helps organizations optimize facilities use, illustrate this point. Determining data goals, making a plan.

article thumbnail

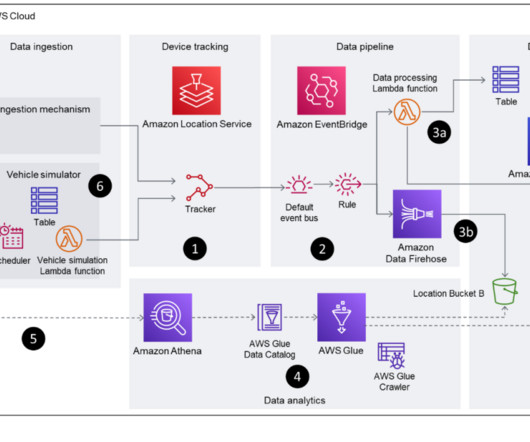
Gain insights from historical location data using Amazon Location Service and AWS analytics services

AWS Big Data

Data analytics – Business analysts gather operational insights from multiple data sources, including the location data collected from the vehicles. This method uses GZIP compression to optimize storage consumption and query performance. Choose Explore table items to view the content of the table.

Insiders

Sign Up for our Newsletter

This site is protected by reCAPTCHA and the Google Privacy Policy and Terms of Service apply.

article thumbnail

Data Science, Past & Future

Domino Data Lab

He also really informed a lot of the early thinking about data visualization. It involved a lot of interesting work on something new that was data management. It involved a lot of work with applied math, some depth in statistics and visualization, and also a lot of communication skills. Those are nice problems to have.

article thumbnail

Best Web Analytics 2.0 Tools: Quantitative, Qualitative, Life Saving!

Occam's Razor

First presented at an eMetrics summit in 2005 the 10/90 rule was borne out of my observations of why most companies fail miserably at web analytics. Move from a data collection obsession and develop a crush on data analysys. Google Website Optimizer. Special Recommendation: ~ Optimizely. The 10/90 Rule!

Analytics 135