Remove 2009 Remove Metrics Remove Risk Remove Testing
article thumbnail

Understanding Simpson’s Paradox to Avoid Faulty Conclusions

Sisense

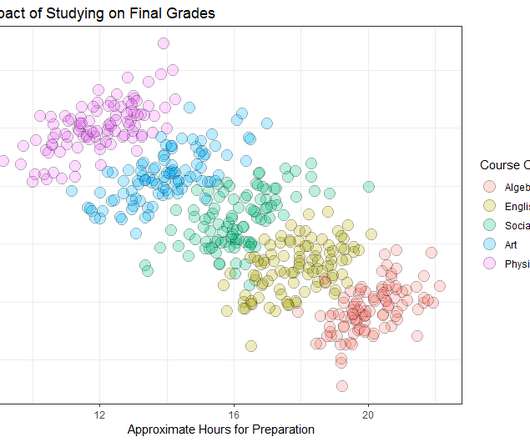
One of the simplest ways to start exploring your data is to aggregate the metrics you are interested in by their relevant dimensions. A new drug promising to reduce the risk of heart attack was tested with two groups. When the data is combined, it seems that the drug reduces the risk of getting a heart attack.

Testing 104
article thumbnail

ML internals: Synthetic Minority Oversampling (SMOTE) Technique

Domino Data Lab

Working with highly imbalanced data can be problematic in several aspects: Distorted performance metrics — In a highly imbalanced dataset, say a binary dataset with a class ratio of 98:2, an algorithm that always predicts the majority class and completely ignores the minority class will still be 98% correct. return synthetic. Chawla et al.,

Insiders

Sign Up for our Newsletter

This site is protected by reCAPTCHA and the Google Privacy Policy and Terms of Service apply.

Trending Sources

article thumbnail

Credit Card Fraud Detection using XGBoost, SMOTE, and threshold moving

Domino Data Lab

Rules-based fraud detection (top) vs. classification decision tree-based detection (bottom): The risk scoring in the former model is calculated using policy-based, manually crafted rules and their corresponding weights. from sklearn import metrics. This is to prevent any information leakage into our test set. Model training.

article thumbnail

Themes and Conferences per Pacoid, Episode 9

Domino Data Lab

That’s a risk in case, say, legislators – who don’t understand the nuances of machine learning – attempt to define a single meaning of the word interpret. Given how so much of IT gets driven by concerns about risks and costs, in practice auditability tops the list for many business stakeholders. Ergo, less interpretable.

article thumbnail

Adding Common Sense to Machine Learning with TensorFlow Lattice

The Unofficial Google Data Science Blog

For example, consider the following simple example fitting a two-dimensional function to predict if someone will pass the bar exam based just on their GPA (grades) and LSAT (a standardized test) using the public dataset (Wightman, 1998). Curiosities and anomalies in your training and testing data become genuine and sustained loss patterns.

article thumbnail

Explaining black-box models using attribute importance, PDPs, and LIME

Domino Data Lab

Because of its architecture, intrinsically explainable ANNs can be optimised not just on its prediction performance, but also on its explainability metric. This dataset classifies customers based on a set of attributes into two credit risk groups – good or bad. random_state=seed) y_train.value_counts().

Modeling 139