article thumbnail

The Lean Analytics Cycle: Metrics > Hypothesis > Experiment > Act

Occam's Razor

To win in business you need to follow this process: Metrics > Hypothesis > Experiment > Act. We are far too enamored with data collection and reporting the standard metrics we love because others love them because someone else said they were nice so many years ago. That metric is tied to a KPI.

Metrics 156
article thumbnail

Brand Measurement: Analytics & Metrics for Branding Campaigns

Occam's Razor

Remember: Engagement is not a metric, its an excuse. ]. Ideally you'll measure the number prior to your branding campaign, say Feb 2009, and then you'll measure it again during your campaign, March 2009. The ideal metrics for this desired outcome are Visitor Loyalty & Visitor Recency. 7 Best Practices ].

Insiders

Sign Up for our Newsletter

This site is protected by reCAPTCHA and the Google Privacy Policy and Terms of Service apply.

article thumbnail

Fact-based Decision-making

Peter James Thomas

Pertinence and fidelity of metrics developed from Data. Metrics are seldom reliant on just one data element, but are often rather combinations. There are often compromises to be made in defining metrics. Integrity of statistical estimates based on Data. For example: Is this a good way to define New Business Growth?

Metrics 49
article thumbnail

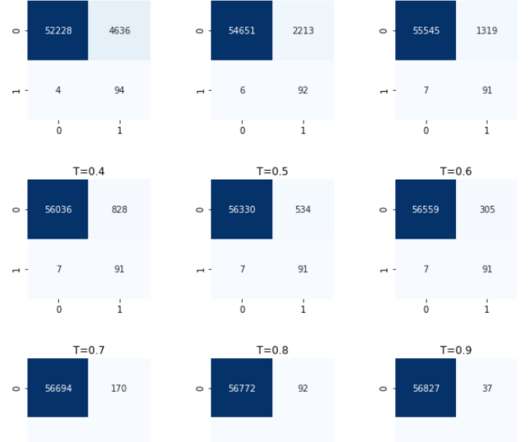
Credit Card Fraud Detection using XGBoost, SMOTE, and threshold moving

Domino Data Lab

In contrast, the decision tree classifies observations based on attribute splits learned from the statistical properties of the training data. Machine Learning-based detection – using statistical learning is another approach that is gaining popularity, mostly because it is less laborious. from sklearn import metrics.

article thumbnail

Understanding Simpson’s Paradox to Avoid Faulty Conclusions

Sisense

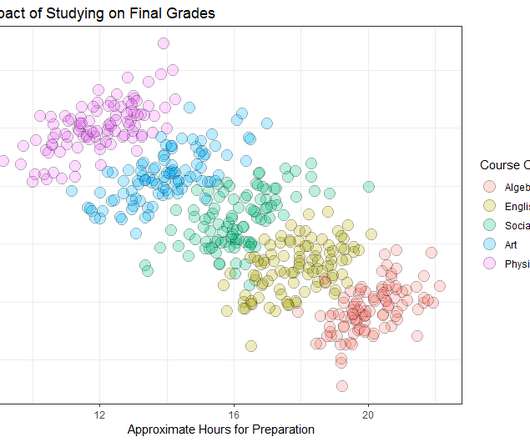
One of the simplest ways to start exploring your data is to aggregate the metrics you are interested in by their relevant dimensions. This is an example of Simpon’s paradox , a statistical phenomenon in which a trend that is present when data is put into groups reverses or disappears when the data is combined.

Testing 104
article thumbnail

Excellent Analytics Tips #20: Measuring Digital "Brand Strength"

Occam's Razor

Bonus One: Read: Brand Measurement: Analytics & Metrics for Branding Campaigns ]. There are many different tools, both online and offline, that measure the elusive metric called brand strength. The tussle between Wal-Mart and Target is interesting. Amazon is an interesting example.

article thumbnail

Themes and Conferences per Pacoid, Episode 9

Domino Data Lab

If your “performance” metrics are focused on predictive power, then you’ll probably end up with more complex models, and consequently less interpretable ones. They also require advanced skills in statistics, experimental design, causal inference, and so on – more than most data science teams will have.