Remove 2011 Remove Metrics Remove Statistics Remove Testing
article thumbnail

The Lean Analytics Cycle: Metrics > Hypothesis > Experiment > Act

Occam's Razor

To win in business you need to follow this process: Metrics > Hypothesis > Experiment > Act. We are far too enamored with data collection and reporting the standard metrics we love because others love them because someone else said they were nice so many years ago. That metric is tied to a KPI.

Metrics 156
article thumbnail

Facebook Advertising / Marketing: Best Metrics, ROI, Business Value

Occam's Razor

FBe's recommendation was (paraphrasing a 35 min talk): Don't invent new metrics, use online versions of Reach and GRPs to measure success. It is possible to get good test and control groups (type of population, existing brand awareness, market penetration, competitive structures) for our experiments. Metrics are a problem.

Insiders

Sign Up for our Newsletter

This site is protected by reCAPTCHA and the Google Privacy Policy and Terms of Service apply.

Trending Sources

article thumbnail

Automating Model Risk Compliance: Model Validation

DataRobot Blog

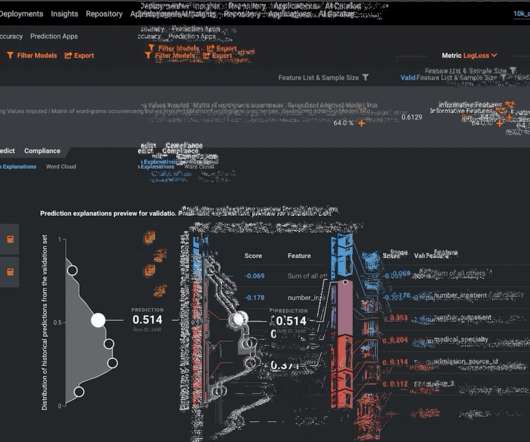
When the FRB’s guidance was first introduced in 2011, modelers often employed traditional regression -based models for their business needs. This may be accomplished through a wide variety of tests, to develop a deeper introspection into how the model behaves.

Risk 52
article thumbnail

Measuring Validity and Reliability of Human Ratings

The Unofficial Google Data Science Blog

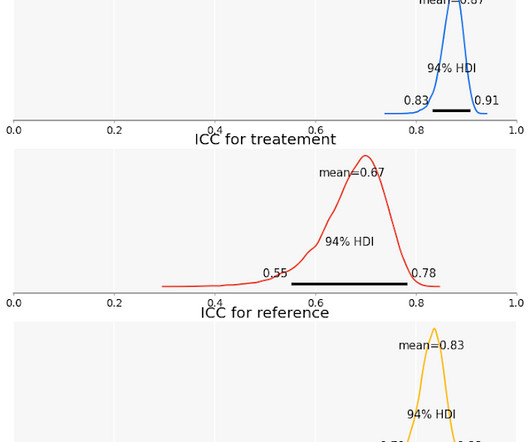
Once we’ve answered that, we will then define and use metrics to understand the quality of human-labeled data, along with a measurement framework that we call Cross-replication Reliability or xRR. We will follow the example of Janson and Olsson , and start from this generalized definition of the metric, which they call iota.

article thumbnail

Unintentional data

The Unofficial Google Data Science Blog

1]" Statistics, as a discipline, was largely developed in a small data world. With more features come more potential post hoc hypotheses about what is driving metrics of interest, and more opportunity for exploratory analysis. We must correct for multiple hypothesis tests. We ought not dredge our data. And for good reason!

article thumbnail

Estimating causal effects using geo experiments

The Unofficial Google Data Science Blog

Similarly, we could test the effectiveness of a search ad compared to showing only organic search results. This means it is possible to specify exactly in which geos an ad campaign will be served – and to observe the ad spend and the response metric at the geo level. They are non-overlapping geo-targetable regions.

article thumbnail

Deep Learning Illustrated: Building Natural Language Processing Models

Domino Data Lab

Although it’s not perfect, [Note: These are statistical approximations, of course!] Note: A test set of 19,500 such analogies was developed by Tomas Mikolov and his colleagues in their 2013 word2vec paper. This test set is available at download.tensorflow.org/data/questions-words.txt.]. Note that the final test word in Table 11.2—ma’am—is