Remove 2012 Remove Optimization Remove Testing Remove Visualization
article thumbnail

Towards optimal experimentation in online systems

The Unofficial Google Data Science Blog

If the relationship of $X$ to $Y$ can be approximated as quadratic (or any polynomial), the objective and constraints as linear in $Y$, then there is a way to express the optimization as a quadratically constrained quadratic program (QCQP). However, joint optimization is possible by increasing both $x_1$ and $x_2$ at the same time.

article thumbnail

Understanding The Value Of Column Charts With Examples & Templates 

datapine

2) Pros & Cons Of Column Charts 3) When To Use A Column Graph 4) Types Of Column Charts 5) Column Graphs & Charts Best Practices 6) Column Chart Examples Data visualization has been a part of our lives for many many years now. They are easy to understand: Column graphs are one of the easiest visualizations to understand.

Insiders

Sign Up for our Newsletter

This site is protected by reCAPTCHA and the Google Privacy Policy and Terms of Service apply.

Trending Sources

article thumbnail

Measure performance of AWS Glue Data Quality for ETL pipelines

AWS Big Data

In this post, we provide benchmark results of running increasingly complex data quality rulesets over a predefined test dataset. Dataset details The test dataset contains 104 columns and 1 million rows stored in Parquet format. On the AWS Glue console, under ETL jobs in the navigation pane, choose Visual ETL.

article thumbnail

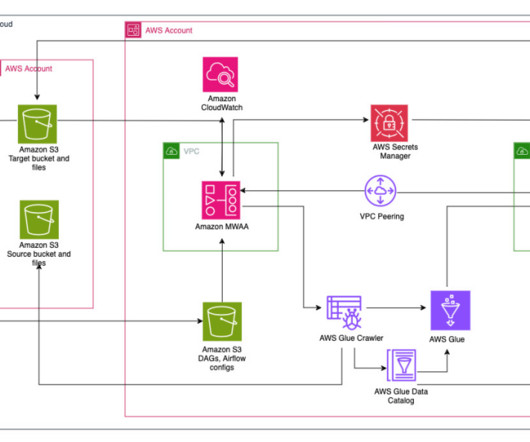
Orchestrate an end-to-end ETL pipeline using Amazon S3, AWS Glue, and Amazon Redshift Serverless with Amazon MWAA

AWS Big Data

Additionally, it enables cost optimization by aligning resources with specific use cases, making sure that expenses are well controlled. The policies attached to the Amazon MWAA role have full access and must only be used for testing purposes in a secure test environment.

Metadata 106
article thumbnail

New Applied ML Prototypes Now Available in Cloudera Machine Learning

Cloudera

There’s recognition that it’s nearly impossible to find the unicorn data scientist that was the apple of every CEO’s eye in 2012. Some companies are starting to segregate the responsibilities of the unicorn data scientist into multiple roles (data engineer, ML engineer, ML architect, visualization developer, etc.),

article thumbnail

Best practices to implement near-real-time analytics using Amazon Redshift Streaming Ingestion with Amazon MSK

AWS Big Data

Establish connectivity between an Amazon QuickSight dashboard and Amazon Redshift to deliver visualization and insights. For optimized performance of the streaming materialized view and to reduce storage usage, occasionally purge data from the materialized view using delete , truncate , or alter table append.

article thumbnail

Key Strategies for Leveraging User Data for Content Marketing

Smart Data Collective

In 2012, we wrote this article on using big data for market research , which you may want to look at. It will also help you determine what type of visuals to use – whether realistic illustrations that can be created by using design accessories like Procreate chain link brushes or infographics.