Remove 2015 Remove Interactive Remove Optimization Remove Statistics
article thumbnail

Take Advantage Of The Best Interactive & Effective Data Visualization Examples

datapine

Table of Contents 1) The Benefits Of Data Visualization 2) Our Top 27 Best Data Visualizations 3) Interactive Data Visualization: What’s In It For Me? Whether static or interactive dashboards , these creative data visualization examples will serve as an inspiration for any data enthusiast. No, data is the new soil.”

article thumbnail

Speed up queries with the cost-based optimizer in Amazon Athena

AWS Big Data

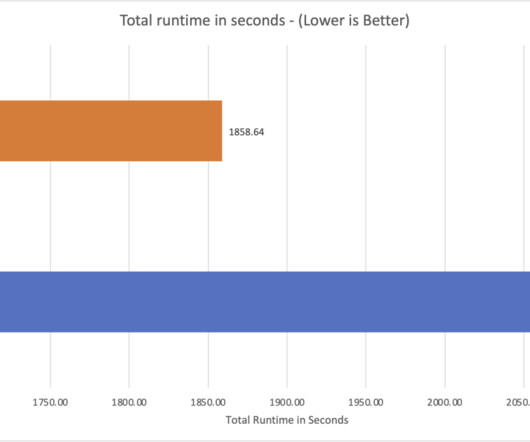
Amazon Athena is a serverless, interactive analytics service built on open source frameworks, supporting open table file formats. Starting today, the Athena SQL engine uses a cost-based optimizer (CBO), a new feature that uses table and column statistics stored in the AWS Glue Data Catalog as part of the table’s metadata.

Insiders

Sign Up for our Newsletter

This site is protected by reCAPTCHA and the Google Privacy Policy and Terms of Service apply.

Trending Sources

article thumbnail

Towards optimal experimentation in online systems

The Unofficial Google Data Science Blog

If $Y$ at that point is (statistically and practically) significantly better than our current operating point, and that point is deemed acceptable, we update the system parameters to this better value. However, if we experiment with both parameters at the same time we will learn something about interactions between these system parameters.

article thumbnail

The Wide World of Data: Enter the Datasphere

Sisense

It’s estimated that around 65% of the world’s population is already connected and interacts with data every day. It’s so significant that in 2014, the UN established its Data Revolution Group to recommend how data can optimize its role as a force for good in sustainable development. This number is projected to rise to 75% by 2025.

article thumbnail

Take Your SQL Skills To The Next Level With These Popular SQL Books

datapine

Amongst the various topics that it covers, ”SQL Performance Explained” offers knowledge into: Correctly applying SQL functions Using indexes correctly How to use LIKE queries efficiently How to optimize join operations Data clustering Database scalability. 17) “SQL Database Programming” (2015 Edition) By Chris Fehily.

article thumbnail

Fitting Support Vector Machines via Quadratic Programming

Domino Data Lab

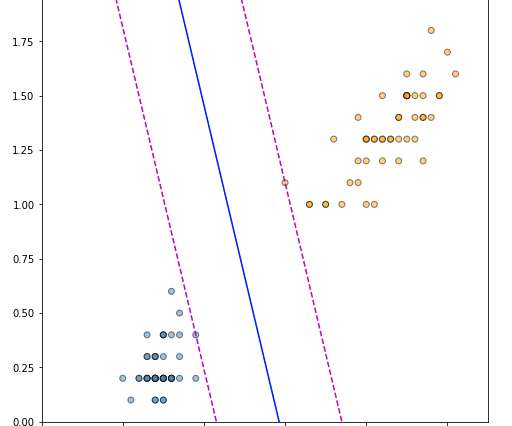
Support Vector Machines (SVMs) are supervised learning models with a wide range of applications in text classification (Joachims, 1998), image recognition (Decoste and Schölkopf, 2002), image segmentation (Barghout, 2015), anomaly detection (Schölkopf et al., Selecting the optimal decision boundary, however, is not a straightforward process.

article thumbnail

Modernize Using The BI & Analytics Magic Quadrant

Rita Sallam

It is defined by a self-contained architecture that enables nontechnical users to autonomously execute full-spectrum analytic workflows from data access, ingestion and preparation to interactive analysis, and the collaborative sharing of insights. Importantly, modern BI platforms are not just being used for self-service.