Remove 2015 Remove Interactive Remove Optimization Remove Visualization
article thumbnail

Take Advantage Of The Best Interactive & Effective Data Visualization Examples

datapine

Table of Contents 1) The Benefits Of Data Visualization 2) Our Top 27 Best Data Visualizations 3) Interactive Data Visualization: What’s In It For Me? 4) Static vs. Animated Data Visualization Data is the new oil? ” – David McCandless Humans are visual creatures. No, data is the new soil.”

article thumbnail

Towards optimal experimentation in online systems

The Unofficial Google Data Science Blog

If the relationship of $X$ to $Y$ can be approximated as quadratic (or any polynomial), the objective and constraints as linear in $Y$, then there is a way to express the optimization as a quadratically constrained quadratic program (QCQP). However, joint optimization is possible by increasing both $x_1$ and $x_2$ at the same time.

Insiders

Sign Up for our Newsletter

This site is protected by reCAPTCHA and the Google Privacy Policy and Terms of Service apply.

Trending Sources

article thumbnail

Create High-Impact Data Visualizations: Nine Effective Strategies

Occam's Razor

In service of that belief, there are few things that bring me as much joy as visualizing data (smart segmentation comes close). While I am partial to the simplest of visualizations in a business data context, I love a simple Bar Chart just as much as a Chord or Fisher-Yates Shuffle. 4: Interactivity With Insightful End-Points.

article thumbnail

Gantt Chart: Examples, Tools, and Templates

FineReport

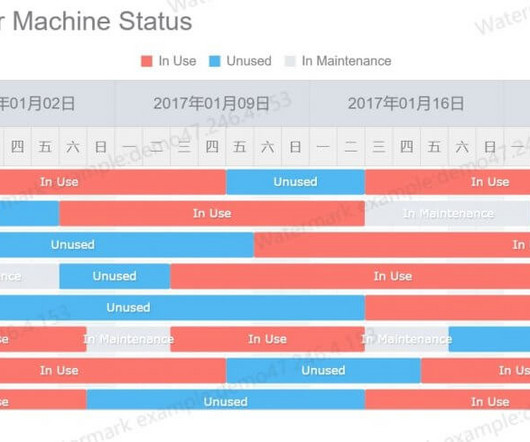
Gantt charts are instrumental in optimizing long-term plans by breaking down mid-to-long-term goals into more manageable short-term plans. Therefore, I will also introduce how to use the professional business intelligence software FineReport as a Gantt chart generator, quickly producing professional and visually appealing Gantt charts.

article thumbnail

How Amazon Devices scaled and optimized real-time demand and supply forecasts using serverless analytics

AWS Big Data

To further optimize and improve the developer velocity for our data consumers, we added Amazon DynamoDB as a metadata store for different data sources landing in the data lake. You can visually create, run, and monitor extract, transform, and load (ETL) pipelines to load data into your data lakes.

article thumbnail

12 most popular AI use cases in the enterprise today

CIO Business Intelligence

Organizations all around the globe are implementing AI in a variety of ways to streamline processes, optimize costs, prevent human error, assist customers, manage IT systems, and alleviate repetitive tasks, among other uses. And with the rise of generative AI, artificial intelligence use cases in the enterprise will only expand.

article thumbnail

Take Your SQL Skills To The Next Level With These Popular SQL Books

datapine

We have already given you our top data visualization books , top business intelligence books , and best data analytics books. Its visually rich format is designed for the way your brain works, not in a text-heavy approach that puts you to sleep. 17) “SQL Database Programming” (2015 Edition) By Chris Fehily.