Remove 2016 Remove Dashboards Remove Interactive Remove Visualization
article thumbnail

The Top 20 Data Visualization Books That Should Be On Your Bookshelf

datapine

Now that you’re sold on the power of data analytics in addition to data-driven BI, it’s time to take your journey a step further by exploring how to effectively communicate vital metrics and insights in a concise, inspiring, and accessible format through the power of visualization. They can be fun and interactive, too.

article thumbnail

13 Essential Data Visualization Techniques, Concepts & Methods To Improve Your Business – Fast

datapine

“By visualizing information, we turn it into a landscape that you can explore with your eyes. 90% of the information transmitted to the brain is visual. Data visualization methods refer to the creation of graphical representations of information. That’s where data visualization comes in. A sort of information map.

Insiders

Sign Up for our Newsletter

This site is protected by reCAPTCHA and the Google Privacy Policy and Terms of Service apply.

Trending Sources

article thumbnail

The Data Visualization Design Process: A Step-by-Step Guide for Beginners

Depict Data Studio

Visualizing data in charts, graphs, dashboards, and infographics is one of the most powerful strategies for getting your numbers out of your spreadsheets and into real-world conversations. But it can be overwhelming to get started with data visualization. If so, this step-by-step data visualization guide is for you!

article thumbnail

Performance Dashboard: Facilitate The Performance of Your Business

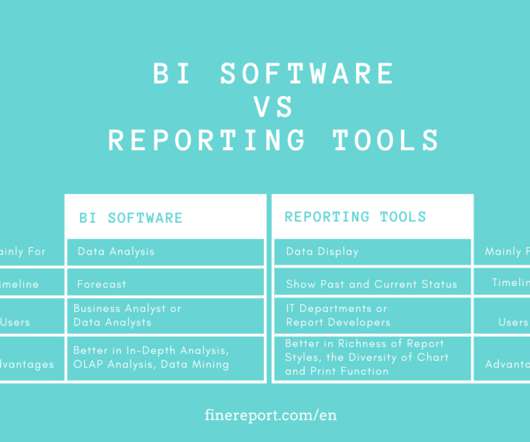
FineReport

Performance dashboard can help you deal with various business problems. What is a performance dashboard? Companies can use performance dashboards to guide various indicators, ranging from checking the ability of a department to monitoring the availability of business strategies for global organizations.

article thumbnail

3 Types of Map Data Visualization in Python

FineReport

What is map data visualization? Before we start to make map data visualization, we need to know what is it? To be simple, map data visualization is to transform geographic data into a visual form. In layman’s terms, map visualization can present geographic data more clearly and directly. Software: Excel.

article thumbnail

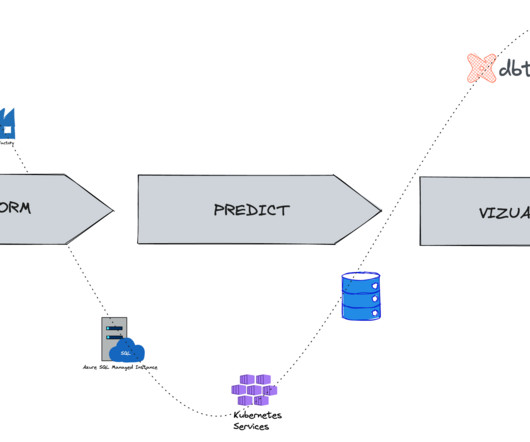
Why the Data Journey Manifesto?

DataKitchen

We wrote the first version because, after talking with hundreds of people at the 2016 Strata Hadoop World Conference, very few easily understood what we discussed at our booth and conference session. We all know that our customers frequently find data and dashboard problems. So why another manifesto in the world? Why should I care?

Testing 130
article thumbnail

Virtual Desks and Dashboards ?of the Future

The Data Visualisation Catalogue

He’s here to explain his vision of the future with dashboards and workspaces from utilising virtual reality (VR) technology. Even though I had charts and dashboards at my disposal, it was still tough to make sense of it all. Below is a guest post from Andy Maggio, the founder of DataView VR. Better Display of Multi-dimensional Data.