Remove 2016 Remove Measurement Remove Statistics Remove Testing
article thumbnail

Misleading Statistics Examples – Discover The Potential For Misuse of Statistics & Data In The Digital Age

datapine

1) What Is A Misleading Statistic? 2) Are Statistics Reliable? 3) Misleading Statistics Examples In Real Life. 4) How Can Statistics Be Misleading. 5) How To Avoid & Identify The Misuse Of Statistics? If all this is true, what is the problem with statistics? What Is A Misleading Statistic?

article thumbnail

Cyber Fraud Statistics & Preventions to Prevent Data Breaches in 2021

Smart Data Collective

In this blog post, we discuss the key statistics and prevention measures that can help you better protect your business in 2021. Cyber fraud statistics and preventions that every internet business needs to know to prevent data breaches in 2021. rose from 38 million in 2016 to over 50 million in 2018. Let’s dive in.

Insiders

Sign Up for our Newsletter

This site is protected by reCAPTCHA and the Google Privacy Policy and Terms of Service apply.

Trending Sources

article thumbnail

Decision-Making in a Time of Crisis

O'Reilly on Data

We know, statistically, that doubling down on an 11 is a good (and common) strategy in blackjack. We saw this after the 2016 U.S. To do so, let’s stick with the example of the 2016 U.S. For example, in different conversations, I told several friends that my COVID-19 test had come back negative. Mike: But I lost!

article thumbnail

LaLiga transforms fan experience with AI

CIO Business Intelligence

The transformation, which started in partnership with Microsoft in 2016, is also enabling LaLiga to expand its business by offering technology platforms and services to the sports and entertainment industry at large. We had some tests in the laboratory first, and then we tested with the fans.

article thumbnail

Towards optimal experimentation in online systems

The Unofficial Google Data Science Blog

the weight given to Likes in our video recommendation algorithm) while $Y$ is a vector of outcome measures such as different metrics of user experience (e.g., Taking measurements at parameter settings further from control parameter settings leads to a lower variance estimate of the slope of the line relating the metric to the parameter.

article thumbnail

The Top 20 Data Visualization Books That Should Be On Your Bookshelf

datapine

But often that’s how we present statistics: we just show the notes, we don’t play the music.” – Hans Rosling, Swedish statistician. Your Chance: Want to test a powerful data visualization software? 14) “Visualize This: The Flowing Data Guide to Design, Visualization, and Statistics” by Nathan Yau. click for book source**.

article thumbnail

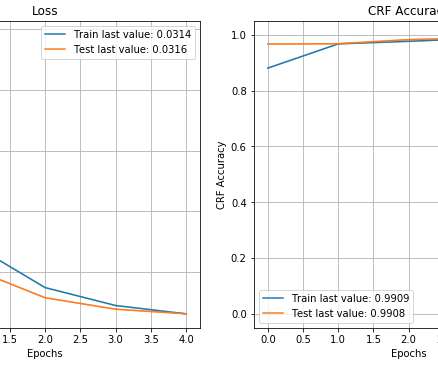
Building a Named Entity Recognition model using a BiLSTM-CRF network

Domino Data Lab

statistical model-based techniques – Using Machine Learning we can streamline and simplify the process of building NER models, because this approach does not need a predefined exhaustive set of naming rules. The process of statistical learning can automatically extract said rules from a training dataset. The CRF model.

Modeling 111