

13 Essential Data Visualization Techniques, Concepts & Methods To Improve Your Business – Fast
datapine
MAY 11, 2022
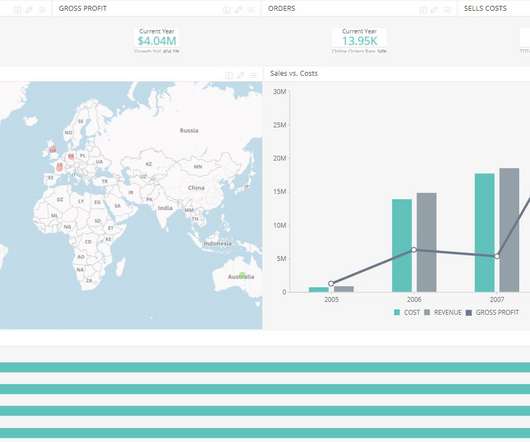
Data visualizations put together in intuitive dashboards can make the analysis process more dynamic and understandable while keeping the audience engaged. This financial analytics metric measures the value of a company’s shares compared to an industry benchmark (second variable). e) Bar or column chart.


Let's personalize your content