article thumbnail

How Insurance Companies Use Data To Measure Risk And Choose Rates

Smart Data Collective

Here is the type of data insurance companies use to measure a client’s potential risk and determine rates. Statistics show that married people have fewer car accidents than singletons. Insurance companies have access to crime statistics and can track the number of car theft and break-ins per neighborhood. Demographics.

Insurance 108
article thumbnail

Give up those Measures and Metrics to Succeed – Really

Andrew White

The period was between 1961 and 2017, when Hong Kong grew from about a quarter as rich as the UK to almost 40%. If bureaucrats start to measure something, it won’t be long before they start to meddle in it. In data and analytics we all know the phrase, ‘you can’t manage what you don’t measure’. For example, GDP was not tracked.

Insiders

Sign Up for our Newsletter

This site is protected by reCAPTCHA and the Google Privacy Policy and Terms of Service apply.

Trending Sources

article thumbnail

An Overview of Revenue Analytics for Event Industry

BizAcuity

This is resulting in the largest event management companies across this sector spending more than $43 billion on revenue analytics – which is a multi-dimensional and evolving field harnessing statistics, Artificial Intelligence and other tools to identify meaningful patterns in large data sets.

article thumbnail

Measuring Validity and Reliability of Human Ratings

The Unofficial Google Data Science Blog

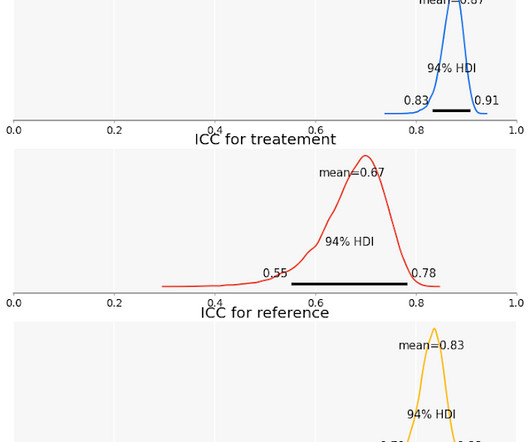
E ven after we account for disagreement, human ratings may not measure exactly what we want to measure. Researchers and practitioners have been using human-labeled data for many years, trying to understand all sorts of abstract concepts that we could not measure otherwise. That’s the focus of this blog post.

article thumbnail

Towards optimal experimentation in online systems

The Unofficial Google Data Science Blog

the weight given to Likes in our video recommendation algorithm) while $Y$ is a vector of outcome measures such as different metrics of user experience (e.g., Taking measurements at parameter settings further from control parameter settings leads to a lower variance estimate of the slope of the line relating the metric to the parameter.

article thumbnail

Our quest for robust time series forecasting at scale

The Unofficial Google Data Science Blog

First, the system may not be understood, and even if it was understood it may be extremely difficult to measure the relationships that are assumed to govern its behavior. For this simple vignette, we might regard $X_1$ and $X_2$ as errors from a measuring scale and note that $X_2$ is not as precise an instrument as $X_1$. OTexts, 2014.

article thumbnail

Themes and Conferences per Pacoid, Episode 9

Domino Data Lab

Finale Doshi-Velez, Been Kim (2017-02-28) ; see also the Domino blog article about TCAV. Adrian Weller (2017-07-29). “ Visualizations are vital in data science work, with the caveat that the information that they convey may be 4-5 layers of abstraction away from the actual business process being measured. 2018-06-21).