Remove 2019 Remove Dashboards Remove KPI Remove Reporting
article thumbnail

Create Modern SQL Dashboards With Professional Tools & Software

datapine

The good news is that you can utilize both with the help of a modern and professional SQL dashboard. That said, in this post, we will take a detailed look into what is a SQL dashboard, how to create one (or several), and provide you with visual examples that will represent the undeniable power that SQL has on offer.

article thumbnail

Effective Report Design: a step-by-step guide

FineReport

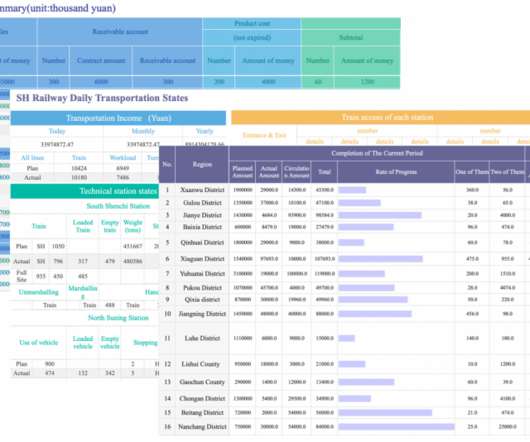
The design of reports can be considered from two aspects: layout and system. You may have seen many articles emphasize how to improve the layout of the report. Today, let’s learn the report designing from the perspective of the report system. The Basics of Report Designing . The Basics of Report Designing .

Insiders

Sign Up for our Newsletter

This site is protected by reCAPTCHA and the Google Privacy Policy and Terms of Service apply.

Trending Sources

article thumbnail

AWS Professional Services scales by improving performance and democratizing data with Amazon QuickSight

AWS Big Data

Our team was formed in 2019 as an informal group of four analysts who supported ad hoc analysis for a division of ProServe consultants. We’ve made a big impact with QuickSight because it doesn’t require in-depth knowledge about data visualizations to build dashboards and provide insights, empowering our users to build what they need.

article thumbnail

Top 10 Types of Report: Examples and How to Design

FineReport

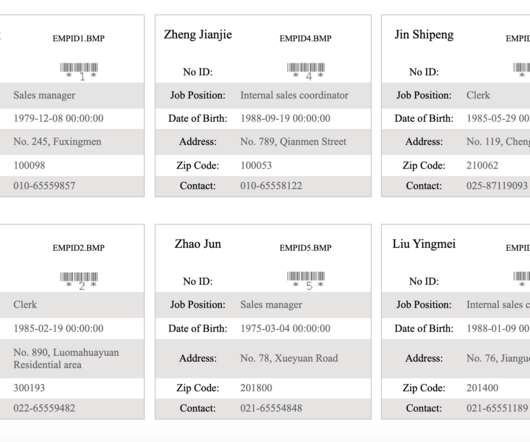
Reports are the basic business requirements of an enterprise. It can help enterprises make better use of data if different data can be presented by appropriate reports. Top 10 Types of Report. Detail Report. Top 10 Types of Report. Detail Report. The detail report is the simplest way to display the data.

article thumbnail

Top 10 Analytics And Business Intelligence Trends For 2020

datapine

Spreadsheets finally took a backseat to actionable and insightful data visualizations and interactive business dashboards. 2019 was a particularly major year for the business intelligence industry. These BI tools make the sharing easier in generating automated reports that can be scheduled at specific times and to specific people.

article thumbnail

Top 10 Free and Open Source BI Tools in 2020

FineReport

The most distinct is its reporting capabilities. Because FineReport can be seamlessly integrated with any data source, it is convenient to import data from Excel in batches to empower historical data or generate MIS reports from various business systems. Dynamic reports. Query reports. Report Management .

OLAP 105
article thumbnail

Introduction To The Basic Business Intelligence Concepts

datapine

A host of business intelligence concepts are executed through intuitive, interactive tools and dashboards – a centralized space that provides the ability to drill down into your data with ease. Data dashboarding and reporting. 4) Data dashboarding and reporting. But more on that later. followed by 18 zeros.