
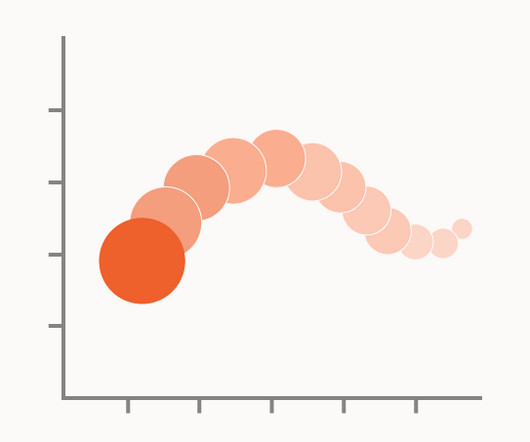
Chart Snapshot: Trail Bubble Charts
The Data Visualisation Catalogue
MAY 9, 2024
A year in Graphic detail, October 2018 – December 2019 — The Economist Fertility and life expectancy. Remixing Rosling — TRUTH & BEAUTY, Moritz Stefaner The post Chart Snapshot: Trail Bubble Charts appeared first on The Data Visualisation Catalogue Blog.


Let's personalize your content