Remove 2023 Remove Dashboards Remove Optimization Remove Reporting
article thumbnail

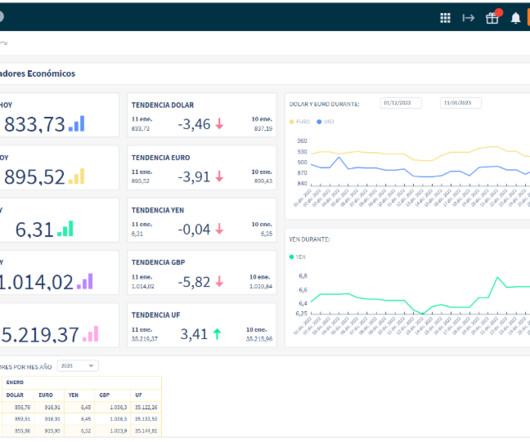
4 Financial Dashboard Examples for 2023

Jet Global

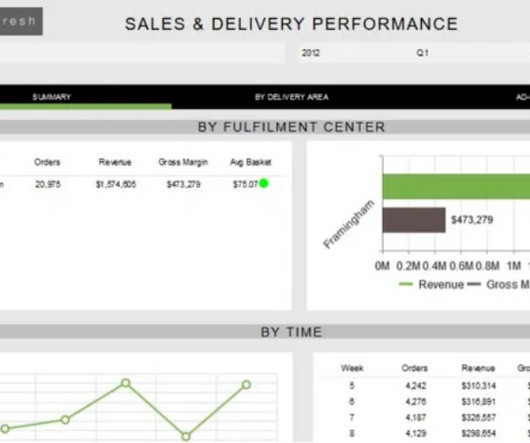
Financial dashboards bring performance into focus by collecting the most important metrics and indicators in one location. But when organizations build their financial dashboards from the ground up, challenges often arise. A primary hurdle is making the right design choices to create dashboards that drive successful business decisions.

article thumbnail

insightsoftware Launches Angles Professional for Oracle to Automate Recurring Operational Reports at the Gartner Data & Analytics Summit 2023

Jet Global

Recognizing a need for better operational analytics, insightsoftware leveraged award-winning technology from Logi Analytics to provide Oracle ERP Cloud users the ability to customize, create, and share interactive dashboards and reports across all departments of a business.

Insiders

Sign Up for our Newsletter

This site is protected by reCAPTCHA and the Google Privacy Policy and Terms of Service apply.

Trending Sources

article thumbnail

Financial Dashboard: Definition, Examples, and How-tos

FineReport

This is where the significance of a financial dashboard shines through. In this article, we will explore the concept of a financial dashboard, highlight its numerous benefits, and provide various kinds of financial dashboard examples for you to employ and explore. What is A Financial Dashboard?

article thumbnail

What is a KPI Report? Definition, Examples, and How-tos

FineReport

To effectively monitor and analyze these metrics, businesses utilize KPI reports. In this article, we will explore the concept of KPI reports, highlight their significance, provide examples and templates, discuss the essential components, and offer valuable insights on creating KPI reports efficiently.

KPI 52
article thumbnail

2023 Predictions: Data Trends That Will Dominate Business Agenda in APAC

Cloudera

Faced with even more pressure to remain resilient and agile amid looming global economic threats, Asia-Pacific (APAC) region businesses are looking to further mobilize emerging technologies such as artificial intelligence (AI) and machine learning that will optimize operational efficiencies and cost savings. .

article thumbnail

Enhance monitoring and debugging for AWS Glue jobs using new job observability metrics, Part 3: Visualization and trend analysis using Amazon QuickSight

AWS Big Data

Grafana provides powerful customizable dashboards to view pipeline health. QuickSight makes it straightforward for business users to visualize data in interactive dashboards and reports. Analyzing historical patterns allows you to optimize performance, identify issues proactively, and improve planning.

Metrics 106
article thumbnail

FanRuan Recognized as an Honorable Mention in the 2023 Gartner Magic Quadrant for Analytics and Business Intelligence Platforms

FineReport

Recently, Gartner released the 2023 Magic Quadrant for Analytics and Business Intelligence Platforms , which highlights the latest trends in BI development and future market demands. FanRuan remains the only independent BI vendor from China to be included in the report, further highlighting its achievements and presence in the industry.