
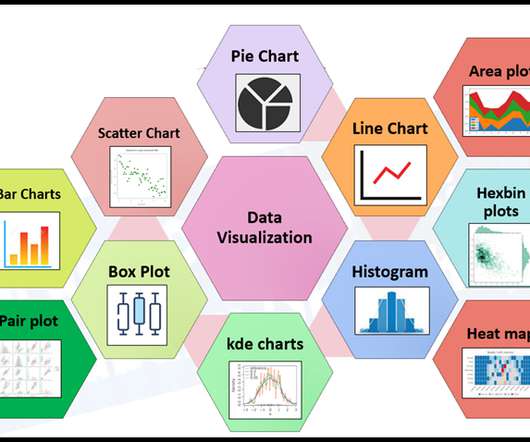
Effective Data Visualization Techniques in Data Science Using Python
Analytics Vidhya
AUGUST 1, 2021
ArticleVideo Book This article was published as a part of the Data Science Blogathon Data Visualization Data Visualization techniques involve the generation of graphical or. The post Effective Data Visualization Techniques in Data Science Using Python appeared first on Analytics Vidhya.


Let's personalize your content