Remove category product-news
article thumbnail

Understanding The Value Of Column Charts With Examples & Templates 

datapine

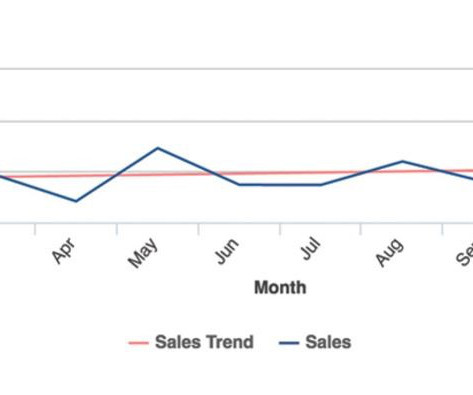
This is because visual representations of data are everywhere, in the news, politics, the media, and advertising, among other areas. Making them the perfect tool to use in the news and the media. For example, in a business context, you can use one to compare sales by product category, specific products, or even sales representatives.

article thumbnail

A Complete Guide To Spider Charts With Best Practices And Examples Of When To Use Them 

datapine

2) When To Use Spider Graphs 3) Types Of Radar Charts 4) Radar Graph Best Practices 5) Spider Chart Examples If you are reading this blog post then you must be somewhat aware of the value of data visualization. As mentioned, this is a great use case to analyze employee performance or even for product development to analyze specific features.

Insiders

Sign Up for our Newsletter

This site is protected by reCAPTCHA and the Google Privacy Policy and Terms of Service apply.

article thumbnail

Discover 20 Essential Types Of Graphs And Charts And When To Use Them

datapine

2) Charts And Graphs Categories 3) 20 Different Types Of Graphs And Charts 4) How To Choose The Right Chart Type Data and statistics are all around us. It is very likely that you have found yourself looking at a chart or graph at work, in the news, sports, media, advertising, and many other places at some point in your life.

article thumbnail

New Applied ML Research: Few-shot Text Classification

Cloudera

For example, recommendation systems rely on properly classifying text content such as news articles or product descriptions in order to provide users with the most relevant information. And in the world of e-commerce, assigning product descriptions to the most fitting product category ensures quality control. .

article thumbnail

Predictive Analytics Helps New Dropshipping Businesses Thrive

Smart Data Collective

Data reviews can also give you insights into what products customers prefer, aiding product making and curation decisions. The good news is that new advances in predictive analytics can help companies develop an edge. Find your niche and winning product. Typically, the product has a price of less than $200.

article thumbnail

A Guide To The Methods, Benefits & Problems of The Interpretation of Data

datapine

While there are several different types of processes that are implemented based on individual data nature, the two broadest and most common categories are “quantitative analysis” and “qualitative analysis”. The varying scales include: Nominal Scale: non-numeric categories that cannot be ranked or compared quantitatively.

article thumbnail

The Superpowers of Ontotext’s Relation and Event Detector

Ontotext

This is part of Ontotext’s AI-in-Action initiative aimed at enabling data scientists and engineers to benefit from the AI capabilities of our products. RED’s focus on news content serves a pivotal function: identifying, extracting, and structuring data on events, parties involved, and subsequent impacts.