Remove category tableau
article thumbnail

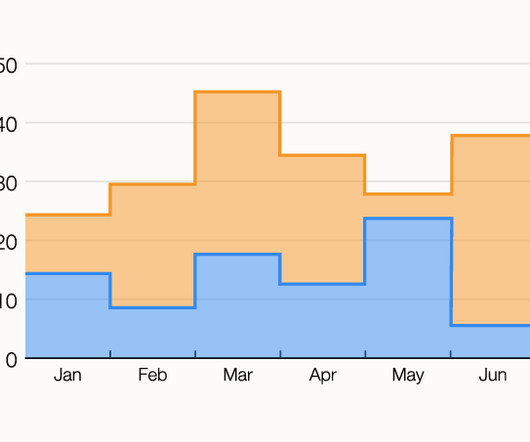
Chart Snapshot: Stepped Area Graphs (Singular & Stacked)

The Data Visualisation Catalogue

Stacking multiple data series on a Stepped Area Graph allows for the comparison of cumulative changes over time and the breakdown of each category at a point in time.

article thumbnail

Hoop Dancing Lessons for Optimizing Your Business Intelligence Deployment

Paul Blogs on BI

We saw the overall winner of the adult category in the opening round and really liked him (and it wasn’t just because his brother was sitting next to us!). Trying to do it in Tableau or PowerBI, that were never designed for this usage, is awkward, time-consuming and will often lead to you compromising on what you really want.

Insiders

Sign Up for our Newsletter

This site is protected by reCAPTCHA and the Google Privacy Policy and Terms of Service apply.

article thumbnail

New Format for The Bar Chart Reference Page

The Data Visualisation Catalogue

First, locate the value scale axis and the category axis, to identify what is being visualised. Each category is assigned its own bar and the length of each bar is proportional to the value it represents. Colour-coding can be assigned to the bars to distinguish each category in the dataset. ” in each category.

article thumbnail

New AI Applications Unlock the Value of AI

DataRobot

If you’re a regular reader of the DataRobot blog, you likely fall into one of two categories. Our blogs target these two groups because they are the primary people who interact with our software. Until now.

article thumbnail

One Big Cluster Stuck: Data Asset Standardization

Cloudera

In Tableau, we prefer to simply assign report ownership to a system user which prohibits further use while enabling us to easily restore it if requested and justified. The post One Big Cluster Stuck: Data Asset Standardization appeared first on Cloudera Blog. Archive targeted reports. Repeat the exercise quarterly.

article thumbnail

Alation Accelerates Growth and Global Impact — and Welcomes 2 New Leaders

Alation

In this blog, I’ll detail how we’ve grown in EMEA specifically, sharing exciting updates and plans for the future. We’ve also had the pleasure of being recognised by peer user review site TrustRadius as a primary leader in the data catalog category, as well as in the data collaboration , data governance , and metadata management categories.

B2B 52
article thumbnail

BI Bake-Off Goes Virtual!

Rita Sallam

This blog post highlights key findings and gives you access to participating vendor demos. Both Microsoft and Tableau channeled the great Hans Rosling by showing cool animations of insights over time. Tableau (Salesforce). Tableau found that the prevalence of obesity is highly correlated with countries’ life expectancy rates.