Remove Blog Remove Experimentation Remove Testing Remove Visualization
article thumbnail

Towards optimal experimentation in online systems

The Unofficial Google Data Science Blog

This blog post discusses such a comprehensive approach that is used at Youtube. To find optimal values of two parameters experimentally, the obvious strategy would be to experiment with and update them in separate, sequential stages. Figure 4: Visualization of a central composite design. production, default) values.

article thumbnail

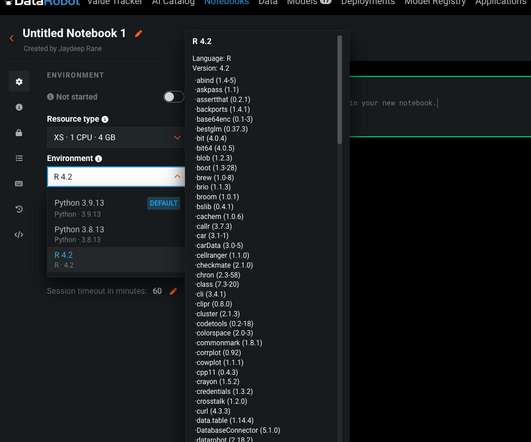
DataRobot Notebooks: Enhanced Code-First Experience for Rapid AI Experimentation

DataRobot Blog

ML model builders spend a ton of time running multiple experiments in a data science notebook environment before moving the well-tested and robust models from those experiments to a secure, production-grade environment for general consumption. Capabilities Beyond Classic Jupyter for End-to-end Experimentation. Auto-scale compute.

Insiders

Sign Up for our Newsletter

This site is protected by reCAPTCHA and the Google Privacy Policy and Terms of Service apply.

Trending Sources

article thumbnail

The DataOps Vendor Landscape, 2021

DataKitchen

Read the complete blog below for a more detailed description of the vendors and their capabilities. Testing and Data Observability. DataOps needs a directed graph-based workflow that contains all the data access, integration, model and visualization steps in the data analytic production process. Testing and Data Observability.

Testing 300
article thumbnail

Demystifying Multimodal LLMs

Dataiku

Moreover, M-LLMs adeptly answer questions about visual content, aiding in tasks like image recognition and scene understanding. In this blog post, we delve into the workings of M-LLMs, unraveling the intricacies of their architecture, with a particular focus on text and vision integration.

article thumbnail

Apply Modern CRM Dashboards & Reports Into Your Business – Examples & Templates

datapine

Finally, we will show you a real-life example so you can get a visual overview and a clearer picture of the points discussed in this article. This most value-driven CRM dashboard and a powerful piece of CRM reporting software host a cohesive mix of visual KPIs. Let’s begin. Sales Activity. Average Contract Value.

article thumbnail

What is a DataOps Engineer?

DataKitchen

DataOps enables: Rapid experimentation and innovation for the fastest delivery of new insights to customers. In this blog, we’ll explore the role of the DataOps Engineer in driving the data organization to higher levels of productivity. A more technical discussion will follow in the next edition of this blog series.

Testing 152
article thumbnail

6 Case Studies on The Benefits of Business Intelligence And Analytics

datapine

Everything is being tested, and then the campaigns that succeed get more money put into them, while the others aren’t repeated. BI users analyze and present data in the form of dashboards and various types of reports to visualize complex information in an easier, more approachable way. What Are The Benefits of Business Intelligence?