

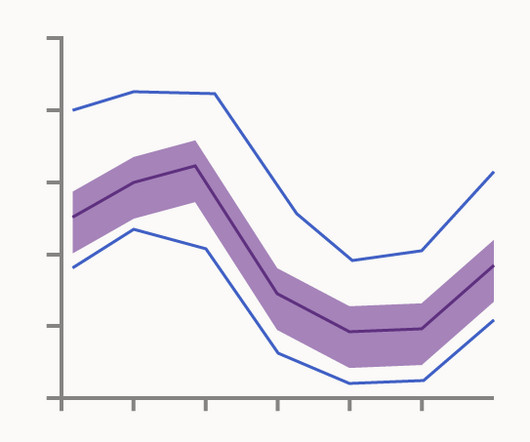
Chart Snapshot: Area Bump Charts
The Data Visualisation Catalogue
MAY 14, 2024
Infographic by titleproloans.com INFOPORN – Murderous Measurements. DensityDesign Lab Related posts: Chart Snapshot: Bump Charts The post Chart Snapshot: Area Bump Charts appeared first on The Data Visualisation Catalogue Blog. WIRED UK — by Valerio Pellegrini I padroni della Silicon Valley.


Let's personalize your content