Remove Blog Remove Optimization Remove Slice and Dice Remove Visualization
article thumbnail

Sisense Q4 2020: Analytics for Every User With AI-Powered Insights

Sisense

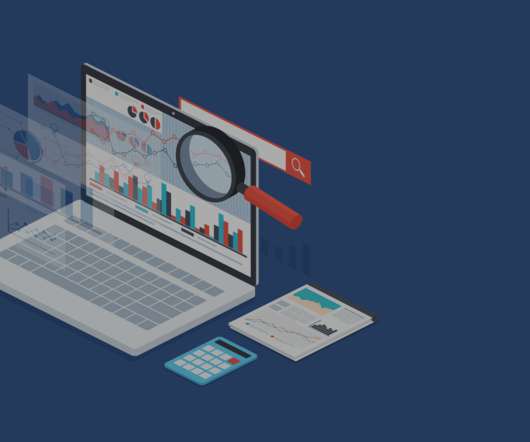
Often, to find those types of insights, you slice, dice, and filter. As another example, if your sales went up by 10%, Sisense might explain that the increase was attributable to both a specific product category and a certain age group of customer with a visual display of the breakdown.

article thumbnail

What is OLAP?

Jedox

In this blog post, we’ll look at the definition of OLAP as well as an overview of the technology. The basis of any EPM solution is digitally available data and O n l ine A nalytical P rocessing (OLAP) organizes and visualizes data multidimensionally. Background and Overview. Background and Overview. are often used.

OLAP 92
Insiders

Sign Up for our Newsletter

This site is protected by reCAPTCHA and the Google Privacy Policy and Terms of Service apply.

Trending Sources

article thumbnail

In Times of Rapid Change, Business Process Modeling Becomes a Critical Tool

erwin

With the help of business process modeling (BPM) organizations can visualize processes and all the associated information identifying the areas ripe for innovation, improvement or reorganization. You then can understand where your data is, how you can find it, how you can monetize it, how you can report on it, and how you can visualize it.

article thumbnail

Sisense’s Q2 Release: A Modern Data Experience Across the Analytics Continuum

Sisense

In-Warehouse Data Prep provides builders with the advanced functionality they need to rapidly transform and optimize raw data creating materialized views on cloud data warehouses. Today’s organizations are more data-driven than ever. Additional capabilities.

article thumbnail

How Model Observability Provides a 360° View of Models in Production

DataRobot Blog

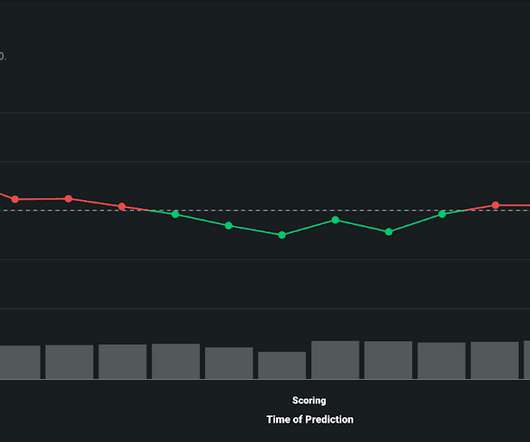
This poses a critical challenge as these models continuously influence key business decisions, such as loans provisioning in financial services , inventory forecasting in retail , or staffing optimization in healthcare. Visualize Data Drift Over Time to Maintain Model Integrity. Monitor Prediction Process to Optimize Workloads.

article thumbnail

How Newcomp Analytics partners with IBM to advance clients’ supply chain insights

IBM Big Data Hub

Left to their own devices, they had resorted to using legacy reporting tools such as Excel that required manual gathering, slicing and dicing of data. Newcomp drew on their technical ability and extensive industry experience with CPG metrics, collaborating with Lindt to understand their business challenges and where to optimize.

article thumbnail

Great Storytelling With Data: Visualize Simply And Focus Obsessively

Occam's Razor

The Directors, the Marketers, the Optimization employees and our resident social media gurus. You can cut yourself with it and embarrass yourself, or you can look the very best you ever have by using it optimally. Avoid complex visualizations – they get in the way! Avoid complex visualizations – they get in the way!