Remove Blog Remove Statistics Remove Testing Remove Visualization
article thumbnail

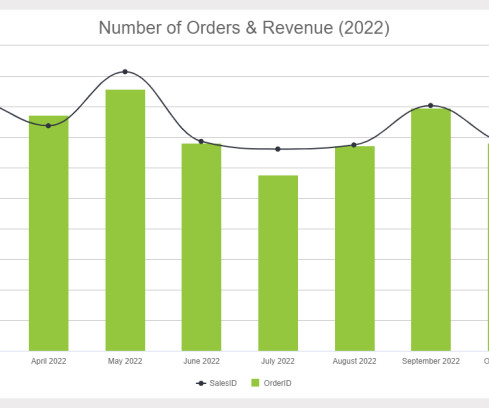
Misleading Statistics Examples – Discover The Potential For Misuse of Statistics & Data In The Digital Age

datapine

1) What Is A Misleading Statistic? 2) Are Statistics Reliable? 3) Misleading Statistics Examples In Real Life. 4) How Can Statistics Be Misleading. 5) How To Avoid & Identify The Misuse Of Statistics? If all this is true, what is the problem with statistics? What Is A Misleading Statistic?

article thumbnail

Decoding the Chi-Square Test?-?Use, Implementation and Visualization

Analytics Vidhya

ArticleVideo Book This article was published as a part of the Data Science Blogathon Introduction In the last blog we looked at a test to. The post Decoding the Chi-Square Test?-?Use, Use, Implementation and Visualization appeared first on Analytics Vidhya.

Testing 155
Insiders

Sign Up for our Newsletter

This site is protected by reCAPTCHA and the Google Privacy Policy and Terms of Service apply.

Trending Sources

article thumbnail

The Top 20 Data Visualization Books That Should Be On Your Bookshelf

datapine

But often that’s how we present statistics: we just show the notes, we don’t play the music.” – Hans Rosling, Swedish statistician. Data visualization, or ‘data viz’ as it’s commonly known, is the graphic presentation of data. That’s a colossal number of books on visualization. Data visualization: What You Need To Know.

article thumbnail

Take Advantage Of The Best Interactive & Effective Data Visualization Examples

datapine

Table of Contents 1) The Benefits Of Data Visualization 2) Our Top 27 Best Data Visualizations 3) Interactive Data Visualization: What’s In It For Me? 4) Static vs. Animated Data Visualization Data is the new oil? ” – David McCandless Humans are visual creatures. This very notion is the core of visualization.

article thumbnail

Why Nonprofits Shouldn’t Use Statistics

Depict Data Studio

— Thank you to Ann Emery, Depict Data Studio, and her Simple Spreadsheets class for inviting us to talk to them about the use of statistics in nonprofit program evaluation! But then we realized that much of the time, statistics just don’t have much of a role in nonprofit work. Why Nonprofits Shouldn’t Use Statistics.

article thumbnail

A Complete Guide To The Power Of Line Graphs With Examples On When To Use Them

datapine

That is because visuals make it easier to convey and understand critical information, breaching the knowledge gap between audiences across industries. That being said, for data visualizations to be successful and avoid misleading your audience, it is necessary to understand the different use cases for each visual.

article thumbnail

Top 5 Statistical Techniques in Python

Sisense

A data scientist must be skilled in many arts: math and statistics, computer science, and domain knowledge. No matter your skill, career level, or title, the ability to analyze, organize, and visualize data are vital skills in our world of quickly growing and ever-changing data. Statistics and programming go hand in hand.