

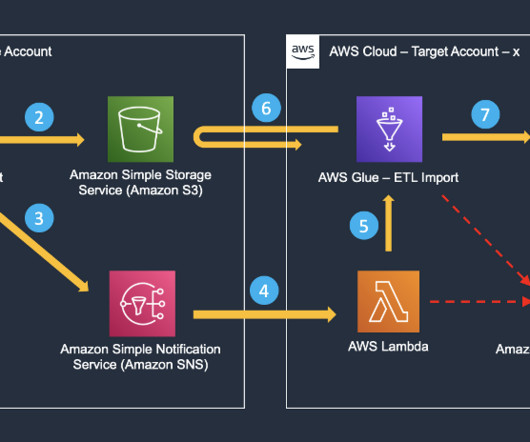
Chart Snapshot: Anchor Chart + Example
The Data Visualisation Catalogue
JANUARY 21, 2024
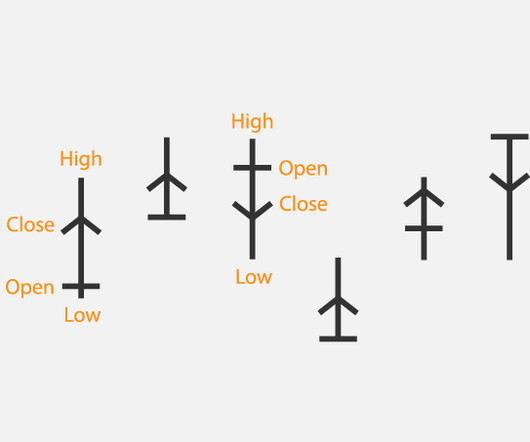
This chart was originally used as a trading tool to visualise and analyse the price movements over time. Example Georgios Karamanis adapted this visualisation method for another purpose: to visualise the viewership of the TV series The Great British Bake Off. Each symbol or ‘anchor’ represents a trading session.


Let's personalize your content