Remove top-5-physical-visualizations
article thumbnail

Most Inspiring: Top 5 Physical Visualizations

Darkhorse

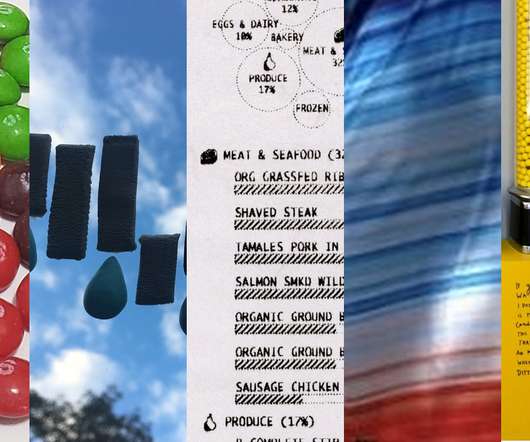
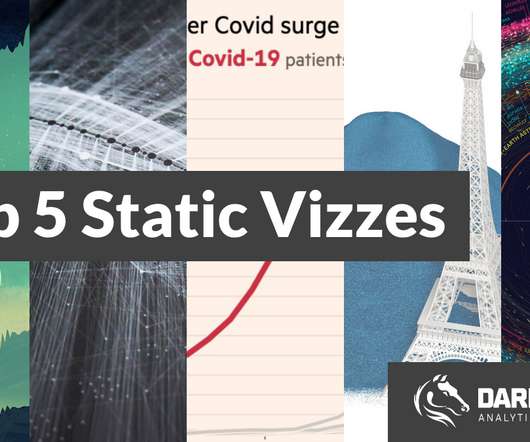
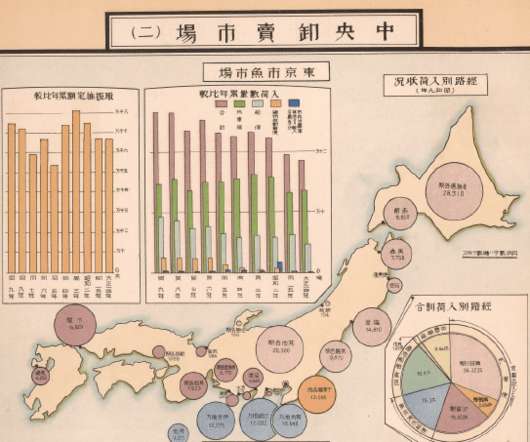
Using physical objects to display data and create visualizations may seem counterintuitive, but doing so can be incredibly effective and engaging. The video above showcases 5 of the most inspiring physical visualizations we’ve come across. In case you missed it, this is last week’s video of the Top 5 Maps.

article thumbnail

Most Inspiring: Top 5 Static Visualizations

Darkhorse

Bar charts, pie charts, and line charts are the most common types of visualizations. 6 minute video: 5 of the Most Inspiring Static Visualizations we’ve come across. Different charts and colors can make visualizations more engaging. The video above showcases 5 of the most inspiring static visualizations we’ve come across.

Insiders

Sign Up for our Newsletter

This site is protected by reCAPTCHA and the Google Privacy Policy and Terms of Service apply.

article thumbnail

The Top 20 Data Visualization Books That Should Be On Your Bookshelf

datapine

Previously, we discussed the top 19 big data books you need to read, followed by our rundown of the world’s top business intelligence books as well as our list of the best SQL books for beginners and intermediates. Data visualization, or ‘data viz’ as it’s commonly known, is the graphic presentation of data.

article thumbnail

Top 15 Warehouse KPIs & Metrics For Efficient Management 

datapine

3) Top 15 Warehouse KPIs Examples 4) Warehouse KPI Dashboard Template The use of big data and analytics technologies has become increasingly popular across industries. Your Chance: Want to visualize & track warehouse KPIs with ease? Table of Contents 1) What Is A Warehouse KPI? 2) Why Do You Need Warehouse KPIs?

Metrics 217
article thumbnail

Top Data Science Tools That Will Empower Your Data Exploration Processes

datapine

To fully leverage the power of data science, scientists often need to obtain skills in databases, statistical programming tools, and data visualizations. Our Top Data Science Tools. We begin our list of the top data science tools with R and RStudio. provides the user with visualizations, code editor, and debugging.

article thumbnail

Best Dashboard Ideas & Design Examples To Boost Your Business Success

datapine

The ability to monitor, visualize, and analyze relevant data gives today’s businesses, across a host of sectors, the power to understand their prospects, make informed decisions, increase efficiencies, and work towards a set of rewarding long term goals. By improving internal communication, top dashboard designs also encourage communication.

article thumbnail

Uncover The Power Of White Label Dashboards & Reports With Key Features And Examples 

datapine

This is an especially valuable practice, especially considering that humans are visual creatures. On the other hand, if you are working with an online dashboard , then a good design practice is to add it at the top in one of the corners. This way, you’ll have a branded and visually appealing end product.