Remove Book Remove Data Integration Remove Data Warehouse Remove Reporting
article thumbnail

Financial Dashboard: Definition, Examples, and How-tos

FineReport

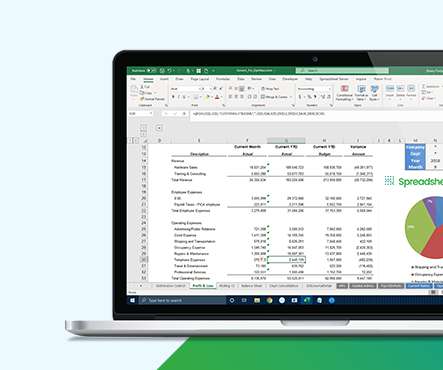
A financial dashboard, one of the most important types of data dashboards , functions as a business intelligence tool that enables finance and accounting teams to visually represent, monitor, and present financial key performance indicators (KPIs). These reports include the cash flow statement, income statement, and balance sheet.

article thumbnail

Five benefits of a data catalog

IBM Big Data Hub

You have a specific book in mind, but you have no idea where to find it. You enter the title of the book into the computer and the library’s digital inventory system tells you the exact section and aisle where the book is located. It uses metadata and data management tools to organize all data assets within your organization.

Insiders

Sign Up for our Newsletter

This site is protected by reCAPTCHA and the Google Privacy Policy and Terms of Service apply.

Trending Sources

article thumbnail

Using Synapse Services with Dynamics? These Tools Make it Easier

Jet Global

Synapse services are powerful tools for bringing data together for analytics, machine learning, reporting needs, and more. Here, we discuss technology solutions that help you leverage the benefits of synapse services for mission-critical financial analysis and reporting in Microsoft Dynamics. Streamline Data with Atlas.

article thumbnail

How AWS helped Altron Group accelerate their vision for optimized customer engagement

AWS Big Data

The reporting zone is based on a set of Amazon Athena views, which are consumed for BI purposes. Athena exposes the content of the reporting zone for consumption. Athena exposes the content of the reporting zone for consumption. The content of the reporting zone is ingested via SPICE in Amazon QuickSight.

article thumbnail

Your guide to AWS Analytics at AWS re:Invent 2023

AWS Big Data

For those in the data world, this post provides a curated guide for all analytics sessions that you can use to quickly schedule and build your itinerary. Book your spot early for the sessions you do not want to miss. 11:30 AM – 12:30 PM (PDT) Ceasars Forum ANT318 | Accelerate innovation with end-to-end serverless data architecture.

Analytics 112
article thumbnail

Best Web Analytics 2.0 Tools: Quantitative, Qualitative, Life Saving!

Occam's Razor

As defined in my second book Web Analytics 2.0 the analysis of qualitative and quantitative data from your website and the competition, 2. For more on why I recommend this specific order please see my second book, Web Analytics 2.0 , which many of you already have. First Bit Of Context. Web Analytics 2.0. Fourth Bit Of Context.

Analytics 135
article thumbnail

Mastering BI Dashboard Tools: Your Essential Guide

FineReport

Key Features of BI Dashboards: Customizable interface Interactivity Real-time data accessibility Web browser compatibility Predefined templates Collaborative sharing capabilities BI Dashboards vs. BI Reports: While both dashboards and reports are pivotal in business intelligence, they serve distinct purposes.