Remove Book Remove Metrics Remove Statistics Remove Testing
article thumbnail

Bringing an AI Product to Market

O'Reilly on Data

Product Managers are responsible for the successful development, testing, release, and adoption of a product, and for leading the team that implements those milestones. The first step in building an AI solution is identifying the problem you want to solve, which includes defining the metrics that will demonstrate whether you’ve succeeded.

Marketing 362
article thumbnail

The Lean Analytics Cycle: Metrics > Hypothesis > Experiment > Act

Occam's Razor

To win in business you need to follow this process: Metrics > Hypothesis > Experiment > Act. We are far too enamored with data collection and reporting the standard metrics we love because others love them because someone else said they were nice so many years ago. That metric is tied to a KPI. But it is not routine.

Metrics 156
Insiders

Sign Up for our Newsletter

This site is protected by reCAPTCHA and the Google Privacy Policy and Terms of Service apply.

article thumbnail

What Is ‘Equity As Code,’ And How Can It Eliminate AI Bias?

DataKitchen

Hopefully, with metrics in place, you can show measured improvements in productivity and quality that will win converts. Test Coverage and Inventory Reports show the degree of test coverage of the data analytics pipeline. A Net Promoter Score is a customer satisfaction metric that gauges a team’s effectiveness.

Testing 130
article thumbnail

Kill Useless Web Metrics: Apply The "Three Layers Of So What" Test

Occam's Razor

Like good little Reporting Squirrels we collect and stack metrics as if preparing for an imminent ice age. In this case its making right choices about the web metrics we knight and sent to the battle to come back with insights for our beloved corporation to monetize. It is called the Three Layers of So What test. And yet we do.

Metrics 117
article thumbnail

Master Data Visualization Techniques: A Comprehensive Guide

FineReport

In scientific research, histograms are commonly used to illustrate the distribution of test scores among students, providing insights into performance patterns and areas for improvement. This technique helps identify correlations or patterns between variables and is widely used in statistical analysis and research studies.

article thumbnail

Understanding Simpson’s Paradox to Avoid Faulty Conclusions

Sisense

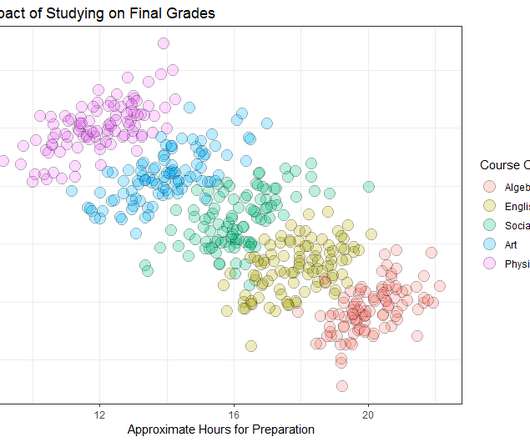
One of the simplest ways to start exploring your data is to aggregate the metrics you are interested in by their relevant dimensions. This is an example of Simpon’s paradox , a statistical phenomenon in which a trend that is present when data is put into groups reverses or disappears when the data is combined.

Testing 104
article thumbnail

The Data Fluency Framework

Juice Analytics

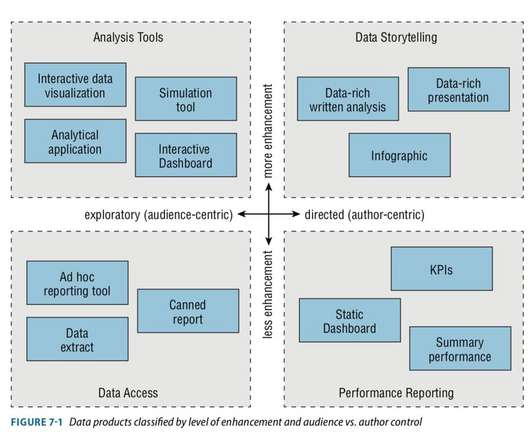
Here’s the framework we first outlined in our book Data Fluency : Data fluency is a web of connected elements. Data authors need to be comfortable with core statistical concepts and comfortable with manipulating data. The foundation of getting value from data depends on creating a data fluent culture in your organization.