Remove Broadcasting Remove Dashboards Remove Interactive Remove Visualization
article thumbnail

Bubble Wrap: How Eurovision Monitors Covid Risk at Events

CIO Business Intelligence

The Eurovision Song Contest, by the way, is the world’s largest live music event, organized each year in May by the local organizer and the European Broadcasting Union. Flockey provides his team with a dashboard for real-time visualization of crowd movement and risks. Social Distancing App Shows Transmission Rates in Real Time.

Risk 93
article thumbnail

How Data Storytelling Can Build Better Customer Connections

Juice Analytics

They have designed a Juicebox report that provides an interactive exploration of weekly and historical results. Densely packed dashboard. Data Storytelling is Writing I hate to take you back to your writing classes but data storytelling isn’t just a collection of data visualizations, it is a form of writing. Tables of data.

Insiders

Sign Up for our Newsletter

This site is protected by reCAPTCHA and the Google Privacy Policy and Terms of Service apply.

Trending Sources

article thumbnail

Take Advantage Of Professional Social Media Reports – Examples & Templates

datapine

By using social media management reporting software to track, measure, and refine your socially-driven efforts, you will make better, swifter, and more informed decisions while maximizing your ROI with every initiative or interaction you make. a) Facebook Page Dashboard. Why Should I Use Social Media Reports? click to enlarge**.

Reporting 178
article thumbnail

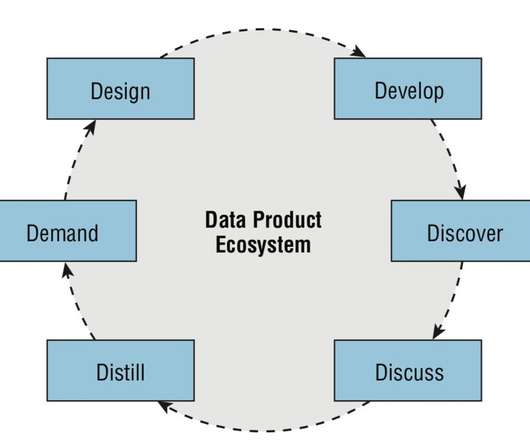
Keys to Data Fluency: Creating the Data Product Ecosystem

Juice Analytics

In fact, for most organizations, the collection of dashboards, reports, and analysis tools feels like a chaotic mess. Tools gather data, visualize the results, and distribute data products to users. In our role as dashboard and analytical application designers, this is an area that is close to home. Easier said than done.