article thumbnail

Why Low-Code No-Code is Important for BI Tools!

Smarten

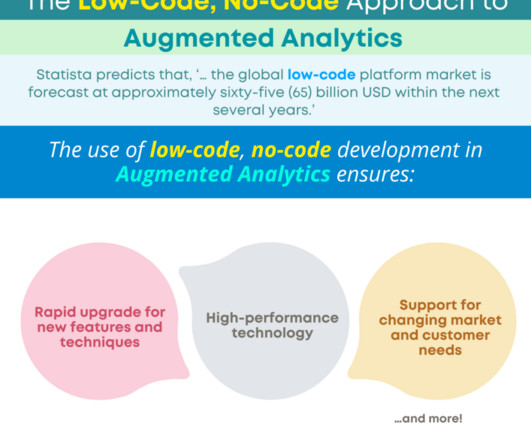
Statista predicts that, ‘… the global low-code platform market is forecast at approximately sixty-five (65) billion USD within the next several years.’ This explanation provides a simple understanding of both approaches and, for the purpose of this article, we will not dive into the details.

article thumbnail

How can CIOs Build Business Value with Business Analytics?

Smart Data Collective

Team Upskilling: Train business analysts on planning, gap analysis, scoping & blueprinting, cost-benefit calculation of new initiatives, solution architecture, modelling, elicitation, requirement management, performance management, and other improvement initiatives. Tools Updating: A business analyst is as good as his/her tools.

Insiders

Sign Up for our Newsletter

This site is protected by reCAPTCHA and the Google Privacy Policy and Terms of Service apply.

Trending Sources

article thumbnail

What is Advanced Analytics and What Are the Benefits of Advanced Analytics?

Smarten

Business Intelligence uses historical data to reveal where the business has been, and managers can use this data to predict competitive response, and ongoing changes in buying behaviour. When an enterprise chooses to implement self-serve Advanced Analytics, it encourages user empowerment and user adoption.

article thumbnail

How Data Analytics Is Revolutionizing The Future Of eCommerce In 2020

Smart Data Collective

Experts forecast that ecommerce providers will spend $6.2 This functionality not only will reduce manual calculation errors, but it will provide valuable data for business analysis. A growing number of ecommerce platforms have expressed the benefits of data analytics technology and incorporated them into their solutions.

B2B 107
article thumbnail

Financial Dashboard: Definition, Examples, and How-tos

FineReport

Financial KPI Dashboard The financial KPI dashboard aggregates vital performance indicators that hold significant importance in business analysis and decision-making. The Dupont analysis model comprises three key components: profit margin, asset turnover, and equity multiplier.