Remove Business Analysis Remove KPI Remove Reporting Remove Software
article thumbnail

Reporting Solutions: A Complete Guide

FineReport

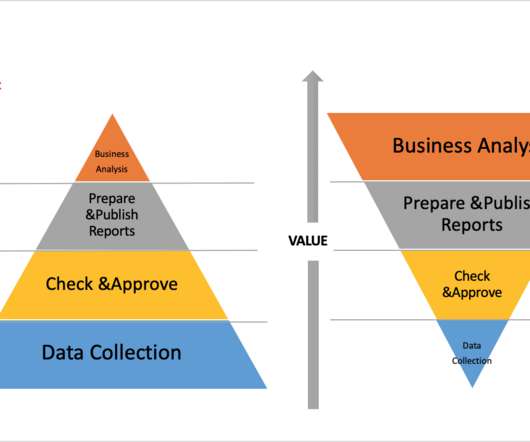
You may have used many tools that have some reporting function built-in. As your business grows, you’ll need complete reporting solutions to handle the fast-changing data and surging reports. Before start, let’s see what are reporting solutions, and what reporting solutions you should look for. .

article thumbnail

Your Data Won’t Speak Unless You Ask It The Right Data Analysis Questions

datapine

Although organizations spend millions of dollars on collecting and analyzing data with various data analysis tools , it seems like most people have trouble actually using that data in actionable, profitable ways. Your Chance: Want to perform advanced data analysis with a few clicks? Data Is Only As Good As The Questions You Ask.

IT 317
Insiders

Sign Up for our Newsletter

This site is protected by reCAPTCHA and the Google Privacy Policy and Terms of Service apply.

Trending Sources

article thumbnail

Why Dashboard Visualization Matters in the 21st century?

FineReport

A visualization dashboard refers to an interactive dashboard that allows the user to track key metrics via different marketing channels, visualize some data points, and create reliable reports for certain purposes. Benefits of data visualization dashboard software. Better analysis- Render data easier to appreciate.

article thumbnail

Financial Dashboard: Definition, Examples, and How-tos

FineReport

A financial dashboard, one of the most important types of data dashboards , functions as a business intelligence tool that enables finance and accounting teams to visually represent, monitor, and present financial key performance indicators (KPIs). These reports include the cash flow statement, income statement, and balance sheet.

article thumbnail

Top 3 Tableau Alternatives for Data Analysis in the 21st Century

FineReport

To choose reliable tableau alternatives, we must mention Tableau Software. It was an American interactive data visualization software company of business intelligence. With the Desktop CS architecture, Tableau runs more smoothly in the design of business analysis. It suits IT staff and business personnel.

KPI 52
article thumbnail

Seize The Power Of Analytical Reports – Business Examples & Templates

datapine

In recent years, analytical reporting has evolved into one of the world’s most important business intelligence components, compelling companies to adapt their strategies based on powerful data-driven insights. What Is An Analytical Report? Your Chance: Want to build your own analytical reports completely free?

Reporting 245
article thumbnail

Business Intelligence Dashboard Software: Make Business Successful

FineReport

Among amounts of intelligent choices, business intelligence(BI) dashboard software is an awesome one. BI dashboard software definition. Business intelligence dashboard is a common module that general business intelligence has to realize data visualization. Benefits of BI dashboard software . FineReport.