Remove Business Analytics Remove Dashboards Remove Forecasting Remove Reporting
article thumbnail

What is business analytics? Using data to improve business outcomes

CIO Business Intelligence

What is business analytics? Business analytics is the practical application of statistical analysis and technologies on business data to identify and anticipate trends and predict business outcomes. The discipline is a key facet of the business analyst role. Business analytics techniques.

article thumbnail

How can CIOs Build Business Value with Business Analytics?

Smart Data Collective

However, the rapid technology change, the increasing demand for user-centric processes and the adoption of blockchain & IoT have all positioned business analytics (BA) as an integral component in an enterprise CoE. They are using analytics to help drive business growth. Conclusion.

Insiders

Sign Up for our Newsletter

This site is protected by reCAPTCHA and the Google Privacy Policy and Terms of Service apply.

Trending Sources

article thumbnail

Business Dashboard: Door To Acute Business Insights

FineReport

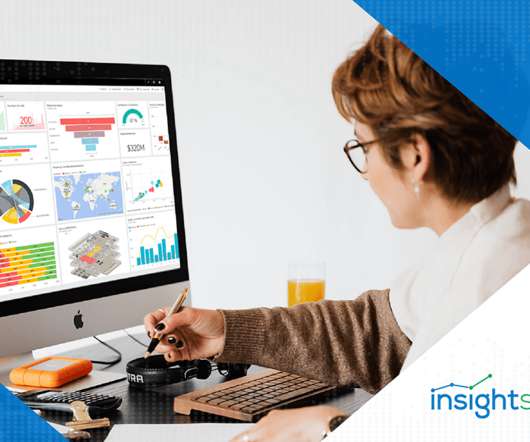
Business dashboard: definition & benefits. What is a business dashboard? Business dashboards dig information from data and present an easily digestible view of business performance to help strategic and decision-making. Cartoon sketch of business dashboard. Stick to visibility.

article thumbnail

What is data analytics? Analyzing and managing data for decisions

CIO Business Intelligence

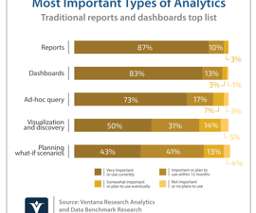
More specifically: Descriptive analytics uses historical and current data from multiple sources to describe the present state, or a specified historical state, by identifying trends and patterns. In business analytics, this is the purview of business intelligence (BI). Data analytics and data science are closely related.

article thumbnail

Join me at Live! 360 Orlando to learn more about Applied Business Analytics

Jen Stirrup

360 Orlando and I’m presenting a workshop on From Business Intelligence to Business Analytics with the Microsoft Data Platform. Data becomes relevant for decision making when we start to use it properly, so this workshop will demonstrate the use of analytics for real-life use cases.

article thumbnail

Take Advantage Of The Top 16 Sales Graphs And Charts To Boost Your Business

datapine

Because after all – a business dashboard is worth a thousand Excel sheets. Let’s examine how you can do so with the following sales KPIs, created for a comprehensive sales report. 2) Sales Target (Actual Revenue vs Forecasted Revenue). This sales chart example is designed for accelerated business growth.

Sales 235
article thumbnail

Decoding Data Analyst Job Description: Skills, Tools, and Career Paths

FineReport

By conducting extensive research and analysis, they generate reports that inform strategic decisions, identify areas for enhancement, and guide the implementation of new initiatives. Data analysts leverage four key types of analytics in their work: Prescriptive analytics: Advising on optimal actions in specific scenarios.