

Take Advantage Of Strategic Dashboard – Read These 8 Tips
FineReport
OCTOBER 8, 2021
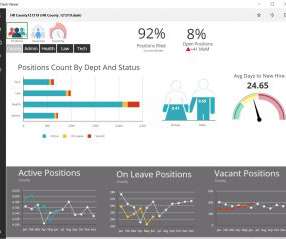
There are three types of dashboards: operational, strategic, and analytical. We have discussed operational dashboards before. Today, I’m going to share more detailed information on strategic dashboards with you. This post will cover the definition, importance, and designing guide on strategic dashboards.


Let's personalize your content