

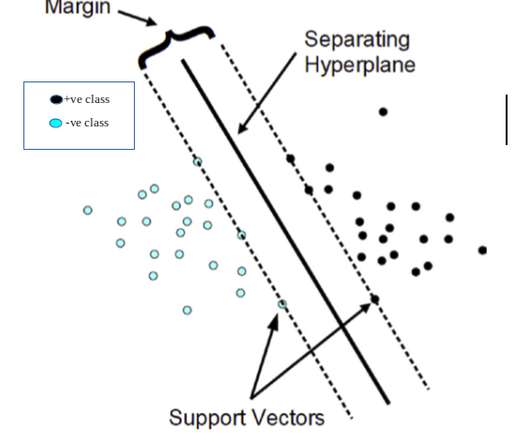
Introduction to SVM(Support Vector Machine) Along with Python Code
Analytics Vidhya
APRIL 26, 2021
The post Introduction to SVM(Support Vector Machine) Along with Python Code appeared first on Analytics Vidhya. ArticleVideo Book This article was published as a part of the Data Science Blogathon. Introduction This article aims to provide a basic understanding.


Let's personalize your content