article thumbnail

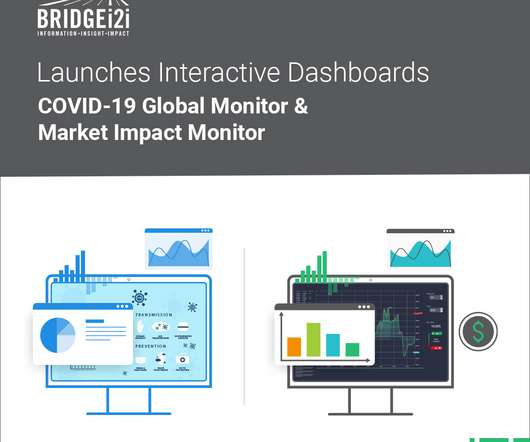
BRIDGEi2i launches two interactive dashboards: COVID19 Global Monitor & COVID Stock Market Impact Monitor

bridgei2i

BRIDGEi2i, a leading AI consultancy, has launched two interactive dashboards that highlight the impact of COVID19 globally across businesses and communities. The Global COVID-19 Monitor gives live insights on the spread of the pandemic across the world and allows you to slice and dice data from many perspectives.

article thumbnail

Super-charged pivot tables in Amazon QuickSight

AWS Big Data

QuickSight dashboards can also be embedded into applications and portals to deliver insights to external stakeholders. This involved migrating complex tables and pivot tables, helping them slice and dice large datasets and deliver pixel-perfect views of their data to their stakeholders. For more details, refer to here.

Insiders

Sign Up for our Newsletter

This site is protected by reCAPTCHA and the Google Privacy Policy and Terms of Service apply.

Trending Sources

article thumbnail

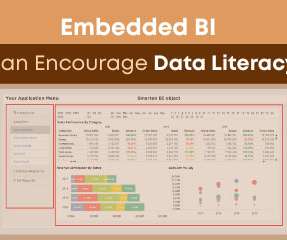
Embedded BI Can Encourage Data Literacy!

Smarten

Technology research and consulting firm, Gartner, predicts that, ‘By 2023, data literacy will become an explicit and necessary driver of business value, demonstrated by its formal inclusion in over 80% of data and analytics strategies and change management programs.’.

article thumbnail

Simplify Metrics on Apache Druid With Rill Data and Cloudera

Cloudera

Cloudera users can securely connect Rill to a source of event stream data, such as Cloudera DataFlow , model data into Rill’s cloud-based Druid service, and share live operational dashboards within minutes via Rill’s interactive metrics dashboard or any connected BI solution. Figure 1: Rill and Cloudera Architecture. Top-N queries.

Metrics 85
article thumbnail

Optimize queries using dataset parameters in Amazon QuickSight

AWS Big Data

With QuickSight, all users can meet varying analytic needs from the same source of truth through modern interactive dashboards, paginated reports, embedded analytics and natural language queries. We have introduced dataset parameters , a new kind of parameter in QuickSight that can help you create interactive experiences in your dashboards.

article thumbnail

Common Business Intelligence Challenges Facing Entrepreneurs

datapine

Also, limited resources make looking for qualified professionals such as data science experts, IT infrastructure professionals and consulting analysts impractical and worrisome. Check out this investor relations dashboard example below, part of our management dashboard series: **click to enlarge**.

article thumbnail

Best Reporting Tools List You Can’t Miss in 2020

FineReport

Wide variety of visualization options such as 3D charts, maps, GIS relationships, dashboards. Best for: C XOs, sales managers, analysts, consultants . Agency Analytics is a marketing campaign focused reporting tool for generating reports and dashboards for SEO auditing and monitoring campaigns. Crystal Reports. Agency Analytics.